Composer User's Guide
CHAPTER 12
Novell exteNd Composer provides many aids to testing and debugging. In fact, in most cases you'll find it possible to do end-to-end animation (complete roundtrip testing) of all services in your project without having to deploy to the app server. Document input/output, XML transformations, transaction-control logic, logging, etc., can be tested in real time using "live" connections to back-end systems. Since Composer's design-time/debug-time environment executes against exactly the same Java classes that are used in the Composer Enterprise Server environment, you can have high confidence that if a service is trouble-free in the design-time setting, it will operate reliably on the app server.
Among the powerful testing and debugging features offered by Composer are:
Robust step-into/step-over animation capability, allowing you to execute a component's action model one line at a time (and pause or abort animation at any time)
Assign unlimited breakpoints and use run-to-breakpoint animation to get quickly from one breakpoint to another
Create "watch lists" of variables and XML elements whose values you want to observe in real time, at various points in an execution cycle
Fault documents and a "Throw Fault" action for flexible exception handling.
Try/On Fault action allows you to trap exceptions, handle them gracefully, and continue executing
These features and strategies for their use will be discussed in this chapter.
Composer's service and component editors provide animation tools that allow you to test and troubleshoot actions interactively within your services and components. You can execute a service or component's Action Model step-by-step and watch the result of each action. Not only will you see any errors as they happen, but you can verify that connections and data have behaved as you had planned.
For concentrating one particular section of an Action Model, the animation tools allow you to toggle one or more breakpoints. When used in conjunction with the run-to-breakpoint tool, breakpoints allow you to quickly run through action-model sections that work properly, coming to a stop at exactly a particular action, From there, you can step through each action in sequence. You can also, optionally, step over loops, Component Actions, and other code blocks that would otherwise be tedious to "step into."

The animation tools are available on the service and component editor Action Model tool bars. In addition to the Action Model tool bars, the editors provide menu options on Composer's Animate menu, as well as corresponding keyboard commands. The table below describes the various tools and their functions.
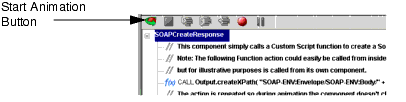
When you first open a service or component, the Start Animation and Toggle Breakpoint tools are the only "enabled" tools; the others are dimmed. Once you click the Start Animation button, the remainder of the Action Animation tools become enabled and you can click them at any point. If you want to halt the animation temporarily, you can use the Pause button. Likewise, if you want to abort the animation, you can do so at any time by clicking the red "End Animation" button.
CAUTION: Although Copy, Paste, and action editing operations (including adding new actions) are all available at animation time, we recommend that you not edit the action model during animation. If you do, exceptions and/or unpredictable behavior may occur. If you need to edit the action model, use the Stop button to abort the animation first, then apply your edits; then begin the animation again.
Open a service or component. The service or component appears in its respective editor.
Click the Start Animation button in the Action pane's tool bar, or press F5 on the keyboard. All of the tools on the action tool bar become active, except for the Start Animation button, which is now dimmed.
Follow the instructions in the sections below to perform the desired Animation activity.
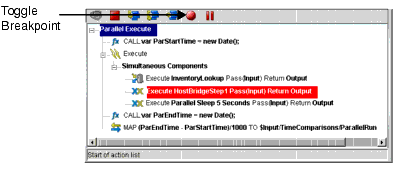
The Toggle Breakpoint tool allows you to set a breakpoint in the Action Model where you'd like the process to stop. This is especially helpful if you have a lengthy Action Model with long sections that work properly. You can set the breakpoints at the beginning of each action that is causing a problem and then step through the action to troubleshoot it.
Open a service or component. The service or component opens in its respective editor.
In the Action pane, select the action where you'd like the breakpoint to be. This is where the animation will stop.
Click the Toggle Breakpoint button on the Action Model tool bar, or press F2 on the keyboard. The action you select changes to a red background with white text.
If desired, repeat steps 3 and 4 to select additional Breakpoints.
If it is not grayed out, click the Start Animation button on the Action Model tool bar. (If Start Animation is grayed out, you can choose another animation tool to complete the animation process from the current breakpoint.) The following changes occur when you click Start Animation:
Follow the instructions in the sections below to perform additional animation processes.
The Run to Breakpoint tool works in conjunction with the Toggle Breakpoint tool to let you control the animation process. When you have a lengthy Action Model it is helpful to be able to control how long you want the animation process to run and at which point you'd like the process to stop. The Run to Breakpoint allows you to do just that.
 To run the animation to a breakpoint:
Open a service or component. The service or component you open appears in its respective editor.
Adjust the editor's panes as necessary to view the Action pane's content.
Select the action that you'd like to be the breakpoint for your test.
Click the Toggle Breakpoint button on the Action pane tool bar, or press F2 on the keyboard.
Click the Start Animation button on the Action pane tool bar, or press F5 on the keyboard. The Action pane of the service or component you've opened should look similar to this:
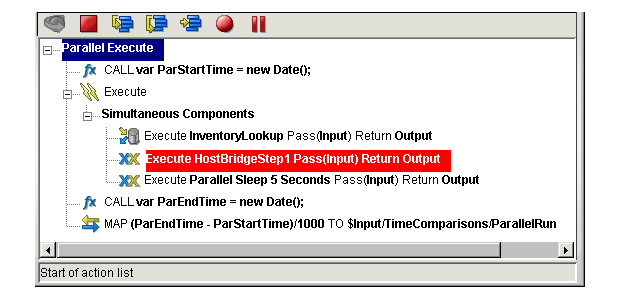
Click the Run to Breakpoint button on the Action pane tool bar, or press F9 on the keyboard. The animation process runs all of the actions prior to the breakpoint, then stops and highlights the breakpoint in red, as shown.
Follow the instructions in the sections below to continue the animation process.
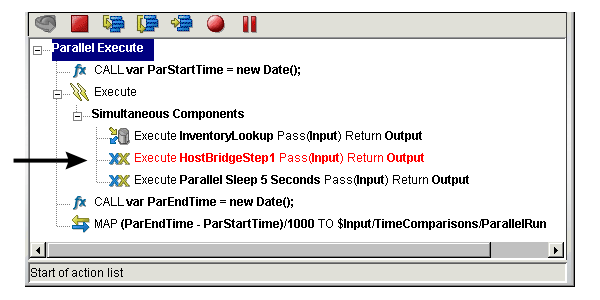
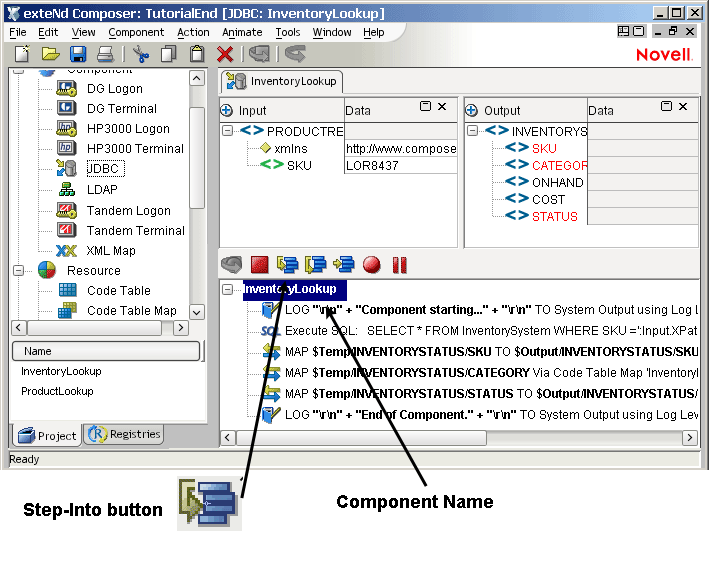
The Step Into tool runs the highlighted action in the Action Model and then moves to the next action in the sequence, even if it is inside another component. (In other words, if the next action is a Component Action, the target component opens and animation continues at the first action in that component's action model. You can use the Step Into tool to step through each action in the entire Action Model, or you can use it in conjunction with the Run to Breakpoint tool. Execution stops at the next breakpoint or when the action model ends, whichever comes first.
A possible scenario for using a breakpoint would be if you have ten actions that you know work properly but have doubts about the eleventh. You could set the eleventh action as a breakpoint, execute the Run to Breakpoint tool, and then step through the eleventh (and subsequent) action(s) by executing the Step Into tool.
NOTE: When a service or component is called from an Action Model and a separate editor opens to display the called object, you must step through that object's Action Model to completion, at which point it closes and you return to the original Action Model.
Open a service or component. The service or component appears in its respective editor.
Adjust the panes as necessary to view the Action Model's content.
Click the Start Animation button on the Action pane tool bar, or press F5 on the keyboard. The Animation tools become active and the object's name is highlighted in the Action Model.
Click the Step Into button on the Action tool bar, or press F7 on the keyboard. The first action becomes highlighted.
Click the Step Into button again. The action executes and the next action becomes highlighted.
Continue to work through the Action Model by clicking the Step Into button after each action executes and the subsequent action becomes highlighted.
When an action that calls another service or component becomes highlighted, click the Step Into button. The following results:
Click the Step Into button on the Action pane tool bar of the called component.
Continue to click the Step Into button to execute all of the actions in the called component. When you've executed all of the actions, the window closes and you are returned to the point in the original Action Model where you left off and the next action is highlighted.
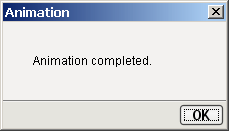
Continue to click the Step Into button to execute all of the actions in the original service or component. When you are done, a message appears.
NOTE: An Action Model may call one or more components, and each component may call components as well. In each occurrence of a called component, the animation tools work exactly the same. For example, you may want to Toggle a Breakpoint within a called component and then perform a Run to Breakpoint in the original service or component. The Action Model begins to execute its actions, opens the called component, and then stops at the breakpoint you've set.
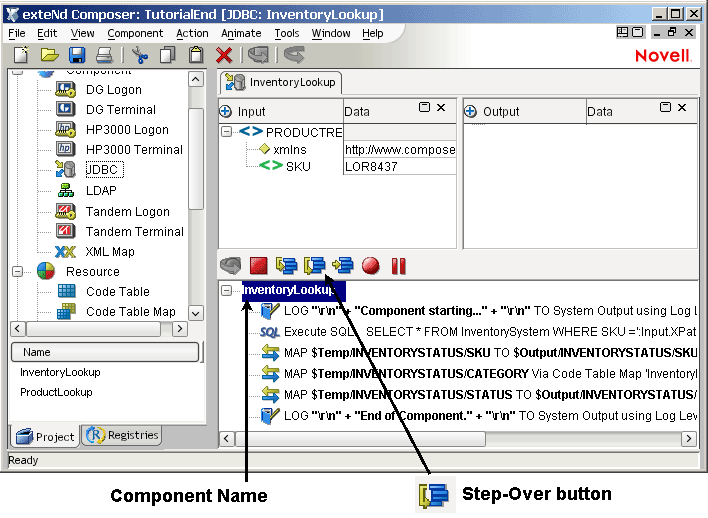
The Step Over tool is useful when you don't want to step into the details of the Component, Repeat, Decision, or Try/On Fault actions.
For a Component action, it means you avoid the potentially timeconsuming opening of a separate editor to continue animating through the target component. The Step Over tool simply executes the target component and then highlights the next action in the Action Model.
Similarly, for blocks of code wrapped in Try/On Fault, Repeat, or other control-flow actions, using Step Over means you can execute an entire block of code at once without stepping individually through each action (which could get tiresome inside a loop).
You'll often find it handy to use the Step Over tool in conjunction with the Run to Breakpoint tool. For example, you could toggle a Breakpoint, execute the Run to Breakpoint tool, and then use the Step Over tool to execute the action you've designated as the breakpoint. The Step Over tool can save a great deal of time when testing lengthy Action Models, since you can avoid tediously stepping through individual actions that might not be of interest to you.
Open a service or component. The service or component appears in its respective editor.
Adjust the panes as necessary to view the Action Model's content.
Click the Start Animation button on the Action pane tool bar. The Animation tools become active and the object's name is highlighted in the Action Model.
Step through the Action Model with the Step Into button until you reach a loop or other line of code that precedesan indented code block.
Click the Step Over button on the Action tool bar, or press F8 on the keyboard. The first action after the block of indented code becomes highlighted. (All of the indented code will execute normally and you will be taken straight to the next "outdented" action, without needing to step through the indented action lines individually.)
Continue to work through the Action Model by clicking the Step Over button as necessary.
Continue to click the Step Into and/or StepOver buttons to execute all of the actions in the Action Model. When complete, a message appears.
The Pause Animation tool allows you to pause the execution of an action in the Action Model. This is especially helpful in cases where Action Models contain lengthy loops.
During the execution of an action, click the Pause Animation button on the Action pane's tool bar, or press F6 on the keyboard.
To resume the animation process, click the Step Into, Step Over, or Run to Breakpoint (if a breakpoint has been set) as desired.
CAUTION: Although Copy, Paste, and action editing operations are available when animation is paused, we recommend that you not edit the action model during animation. If you do, exceptions may occur.
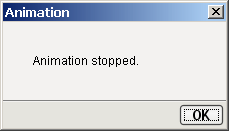
The Stop Animation tool simply stops the animation process. Once you stop the animation, you cannot restart from the place where you left off: you must restart from the beginning of the Action Model.
While the animation is in progress, click the Stop Animation button on the Action pane's tool bar, or press Shift + F5 on the keyboard. The following message appears.
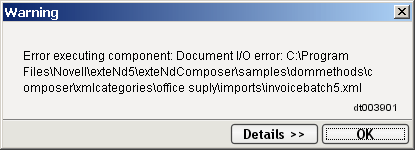
If an action does not execute correctly, an error message appears.
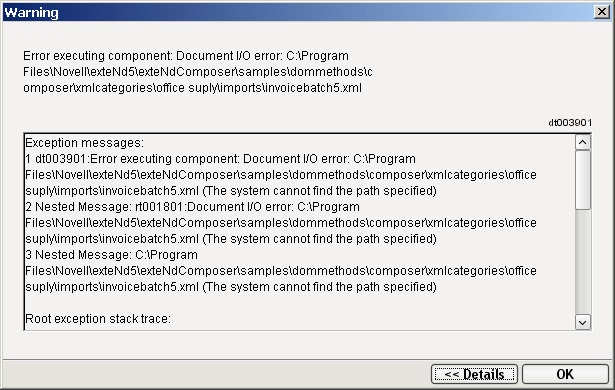
You can click the Details button to read more about the problem encountered. This will give you the full Java stack trace.
Error messages are also written to the System Log, which is viewable from the Composer View menu.
NOTE: Composer's Log (or Output) pane will also show messages. To get the most comprehensive reporting of messages to the Log tab, set the Log Threshold to one in the General tab under Tools > Preferences. Also, check the Show Stack Trace checkbox in the same dialog.
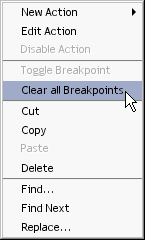
Once you have your action model working properly you will want to run through it from start to finish without interruption. To do this, you'll need to eliminate any breakpoints you had previously set. All your breakpoints can easily be removed at once using the Clear All Breakpoints menu option. This can be accessed in two ways:
While in the Action Panel of the Component Editor, right-click to bring up the contextual menu. Select Clear All Breakpoints.
You may find it desirable or necessary, during a testing or debugging session, to reset the component's input, output, temp, and fault documents to their original states. You can do this manually by using the Reload XML Documents command under the Component menu on the main menubar.
You can completely clear a document, including its root node, programmatically, using ECMAScript. Insert a Function Action that contains code similar to the following:
Temp.removeChild( Temp.firstChild );
Execute the statement using the Execute button on Composer's main toolbar, or use the Apply button in the Function Action dialog. You will see the contents of the Temp document (in this case) "zero out."
NOTE: The removeChild() method and the firstChild property are standard DOM ECMAScript extensions defined by W3C. You can use these and other methods to remove, add, or modify any portion of a document's structure in any action that uses ECMAScript. See Custom Scripting and XPath Logic in exteNd Composer, for more information.
You may find it useful to leverage one or more of the following techniques when testing and debugging action models:
The ECMAScript alert() function, as well as java.lang.System.out.println()
Project variables as a way of conditionally enabling debug code
Watch list (data values that you want to watch at animation time)
Each of these is discussed below.
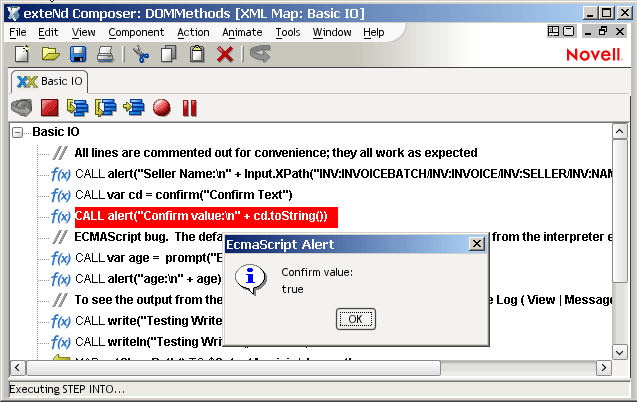
You may want to inspect a data value before and/or after running a map or other type of action. To do so, you can create Function actions that contain the ECMAScript alert() function. The alert function displays a message box with a value you specify.
In the following example, an alert function action has been constructed so as to display a confirmation value of true.
NOTE: You will want to disable any actions that use the alert() function prior to deploying your project to the app server environment. The alert() functionality is of use in design-time testing only. It should not be allowed to execute after deployment to the app server.
If your component or service contains many debugging related actions, you can ensure they do not run when your project is deployed. One way to do so is to create a project variable that can be used in a Decision action to decide whether to execute your debugging actions. Then place all your debugging-related actions inside Decision actions in your components.
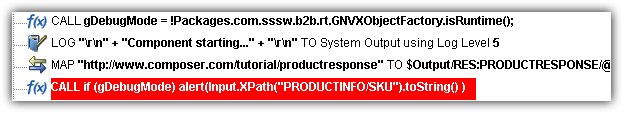
Another tactic is to use a direct call into one of Composer's internal methods to determine whether the current environment is a runtime one versus a design one:
gDebugMode = !Packages.com.sssw.b2b.rt.GNVxObjectFactory.isRuntime();
This is an example of using ECMAScript to call a custom Java method. The result here is that the (component-scoped) variable gDebugMode contains true if the component is running in Composer at design (or animation) time, but false if the component is running in a deployed project on a server.
An example of using this "sentinel variable" to decide whether it's okay to call alert() is shown below:
NOTE: Log Actions are also invaluable for debugging and can be controlled easily via the General tab of the Preferences dialog. See "The Log Action" beginning on page 140.
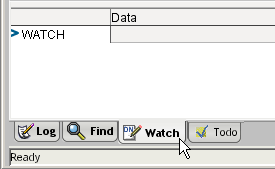
You can watch specific data values change at animation time by adding one or more variables or data nodes to a watch list.
The watch list is visible when you bring the Watch tab (in the output pane, at the bottom of Composer's main window) to the front.
The Watch list is essentially an in-memory XML document (DOM) to which "watched" data items can be added or deleted. Watch-data updates in real time as you step through a component or service. Of course, the Watch view is strictly a design-time aid: It does not exist at runtime (on the server).
You can create a Watch list for each component and switch back and forth between components; each list is scoped to its own component.
If you add a Watch list variable or variables to a component, then re-Save the component, the Watch list will be there again the next time you open the component. The list is persisted along with the component.
You can also Save a Watch list as an XML file at any time. (Use the Save As XML menu command that appears in the context menu when you right-click the WATCH node.) This can be useful for troubleshooting purposes, since it lets you compare Watch list values at the same point in two different execution runs in two different design sessions.
You can add two types of variables to the Watch view: ECMAScript variables and DOM nodes (for example: elements). If the DOM node is not a leaf node, it can be added to the Watch list either as a single node or with all its children. (The Watch target can be defined using XPath.)
NOTE: Watch lists are read-only. You can add and remove items in the Watch window, but you cannot change the values of those items yourself.
You can add items to the Watch tree in any of three ways:
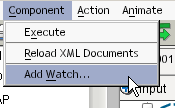
By using the Add Watch... menu command under Component (in Composer's menubar), as shown below.
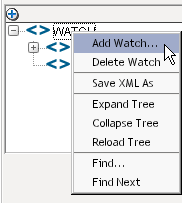
By using the Add Watch command in the context menu that appears when you right-mouse-click on any node in the Watch view itself. Note that in addition to the Add Watch command, the context menu provides Delete Watch and other commands, as shown here:
By using drag-and-drop: Just pull any node of any XML document that's visible in tree-view mode down to the Watch window and let go out of the mouse. The node(s) in question will be added to the Watch list.
NOTE: The drag-and-drop method is useful for document nodes only. To add ECMAScript variables to the Watch window, you must use the Add Watch menu command. See example below.
The following steps show how to add a variable to a watch list, animate through a Component so as to see the variable change value, and delete an item from the list.
Click the Watch tab (at the bottom of the Composer main window) to bring it forward.
Right-mouse-click the root node ("WATCH") of the Watch view. A context menu appears. (See illustration above.)
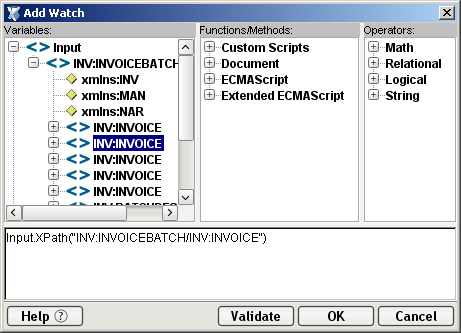
Select Add Watch from the context menu. A dialog appears:
This dialog is an expression builder: It lets you construct an ECMAScript expression that evaluates to an XPath value. You can do this in point-and-click fashion by choosing appropriate items in the pick-lists in the top three panes of the dialog. For example, if you want to add the Input element at INV:INVOICEBATCH/INV:INVOICE to your Watch list, using the above example, you would simply open the Input tree nodes as shown and doubleclick the appropriate node. The corresponding ECMAScript statement appears automatically in the text-edit field, as shown above.
NOTE: If you are interested in watching an ECMAScript variable, simply type the variable's name. (You must enter it by hand since ECMAScript user variables are not shown in the pick-lists.)
Optionally use the Validate button to check the syntax of the expression.
Notice that the node or variable in question has been added to the Watch view. If the variable is a DOM node with children, doubleclick the node (or single-click the plus sign next to it) to toggle the node open, exposing its children and their values.
Now click the Start Animation button to begin stepping through your action model.
As you step through actions that change the values associate with the Watch variable(s), notice how the values change.
To delete the Watch variable, right-mouse-click the node in question and choose Delete Watch from the context menu. The item disappears.
There are significant environmental differences between Animation testing in Composer and Deployment testing. Both types of testing are needed to adequately verify the components and services you build. The differences are detailed in the table below.
Copyright © 2004 Novell, Inc. All rights reserved. Copyright © 1997, 1998, 1999, 2000, 2001, 2002, 2003 SilverStream Software, LLC. All rights reserved. more ...