10.2 Using the Dashboard
NOTE:The exercises in the remainder of this chapter introduces you to some of the very basic analytical features of the Analytics Tools. Through familiarizing yourself with these basic features, you will become proficient enough with these tools to try more advanced features.
-
In the region of the Dashboard, deselect one or two of the check boxes and observe how the changes are reflected in the , , and regions of the Dashboard.
-
In the region, click a specific year.
-
Observe the changes in the , , and regions of the Dashboard.
The graphical displays in the , , and regions of the Dashboard are driven by the region and the selected years from the and regions.
-
In the region, place the cursor over a pie graph section and observe how sectional-specific information appears in a balloon.
-
Double-click the pie graph section and observe how the Dashboard drills down to show data specific to the selected section in the , , and regions.
-
Right-click a section of the new pie graph and select to view the individual filenames.
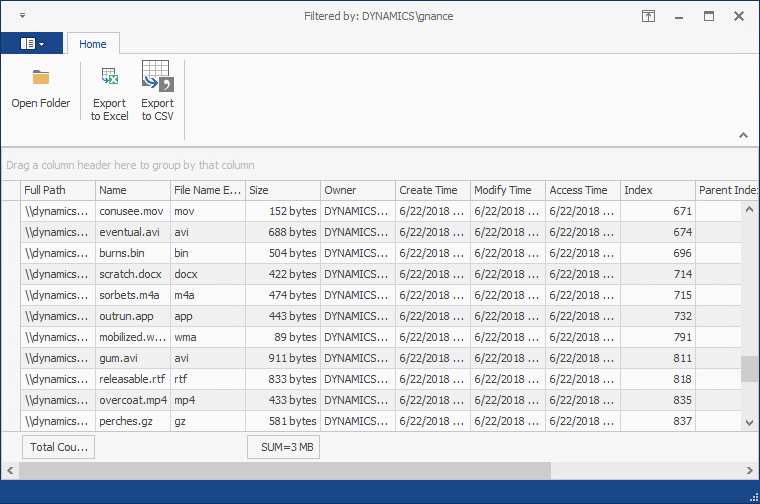
-
From the grid, right-click a file and select to open the folder where the file is located.
The Dashboard gives you the ability to easily access any files you might want to know about.
-
Close the grid.
-
Drill up to the originally displayed data by clicking the Drill Up arrow pertaining to the region of the Dashboard.
-
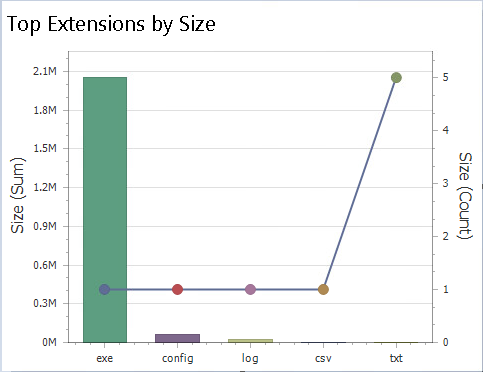
In the region, place the cursor over one of the bars and observe how sectional-specific information appears in a balloon.
-
In the region, right-click and select .
-
Save the image to a location on your desktop.
The graphic can now be used in a presentation or report.
-
In the region, double-click a year span and observe how the displayed data in the other regions is updated to data pertaining to the selected year.
-
Right-click the selected year span and select to have the graph span all of the years again.
-
In the region, double-click a year span and observe the change in the displayed data in the Dashboard.
-
Place the cursor over a bar in the region, right-click and select .
-
Observe that in addition to printing, you can save the graph as a PDF or email the graph.
-
Close the Print Preview page.