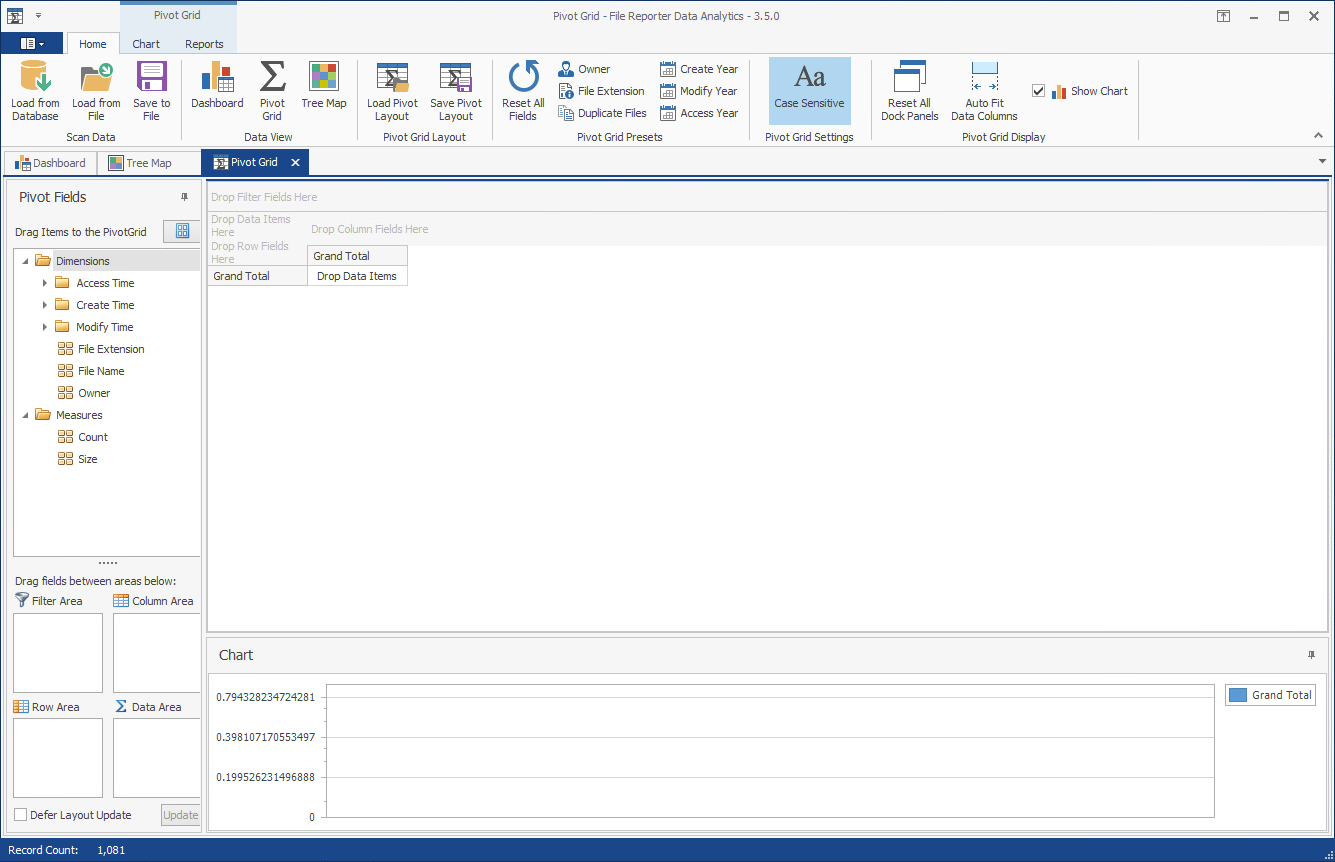
10.4 Using the Pivot Grid
The Pivot Grid gives you the ability to visually analyze data according to combinations of variables.
-
From the Dashboard, click .
-
Browse to select the file system scan you want and double-click it.
-
Click .
-
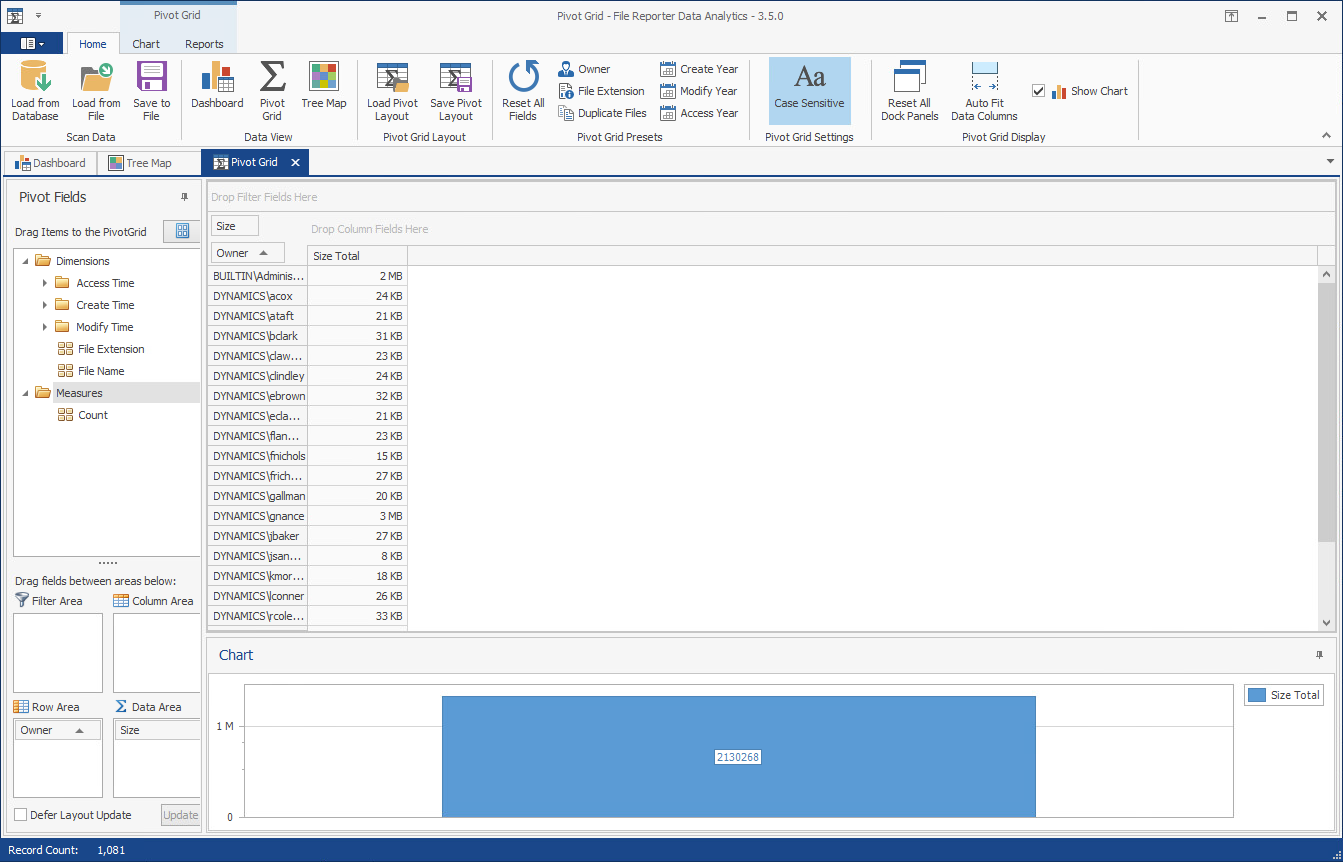
From the region, select (residing in the folder) and drag it up to the area marked .
-
Again in the region, select and drag and place it in the area marked .
-
Observe the totals now calculated for the two data variables.
-
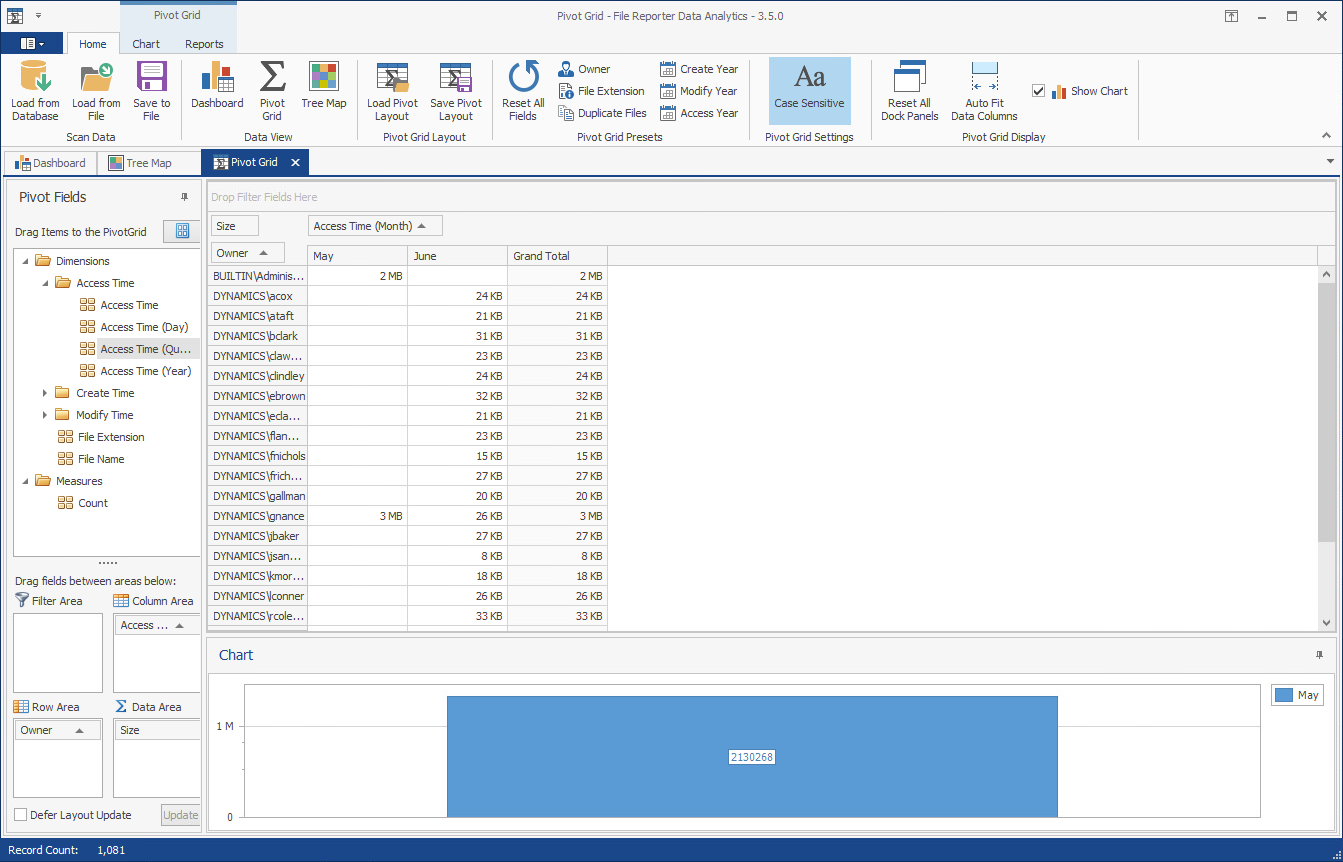
From the region, expand to locate and drag it up to the area marked .
-
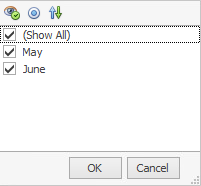
Click the filter icon from the filter that you just placed.
-
Deselect all but one month and .
-
Click the tab.
-
Highlight three consecutive rows to view the data analyzed as graphs in the region.
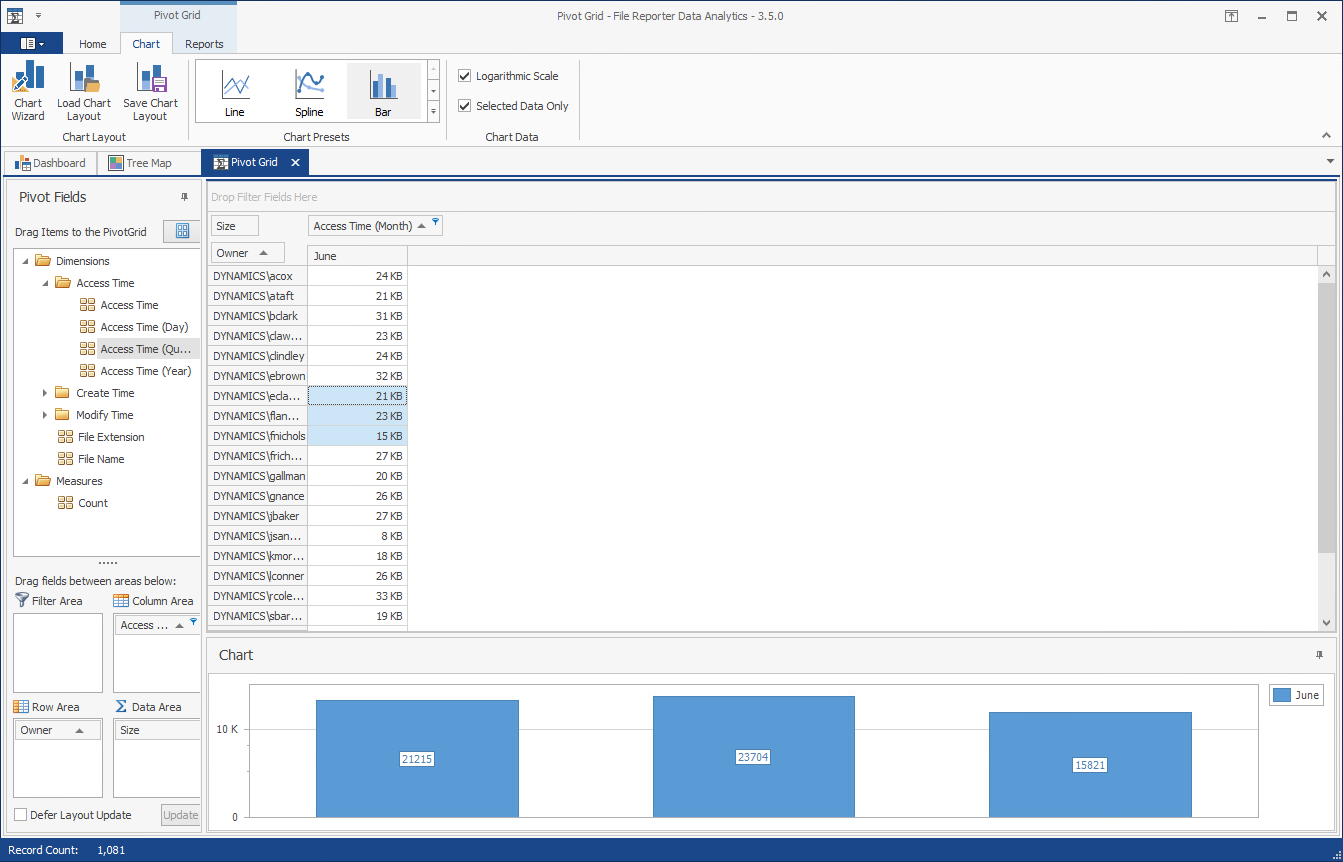
-
From the options, experiment with different chart views of the data.
-
Double-click a selected cell from the table to access the Scan Data Details table specifying all of the files accessed by that user during that month.
-
From the Scan Data Details table, right-click a file and select to open the parent folder of the file.
With the parent folder open, you can examine the file, move it to another location, or delete it.
-
Click the tab.
-
Again, highlight three consecutive rows.
-
Click .
-
Observe that you have the option to print the report or export it to a number of different formats.