11.3 Designing a Custom Query Report
After you have created a Custom Query Report, either through the Report Designer Query Editor or the Query Editor built into the browser-based administration interface, you can design the layout of the report.
NOTE:This exercise introduces you to some of the very basic design features of the Report Designer. Through familiarizing yourself with the basic features, you will become proficient enough in the interface to try more advanced features.
For a more detailed explanation of features in the Report Designer, refer to: https://devexpress.github.io/dotnet-eud/interface-elements-for-desktop/articles/report-designer/report-designer-for-winforms.html.
-
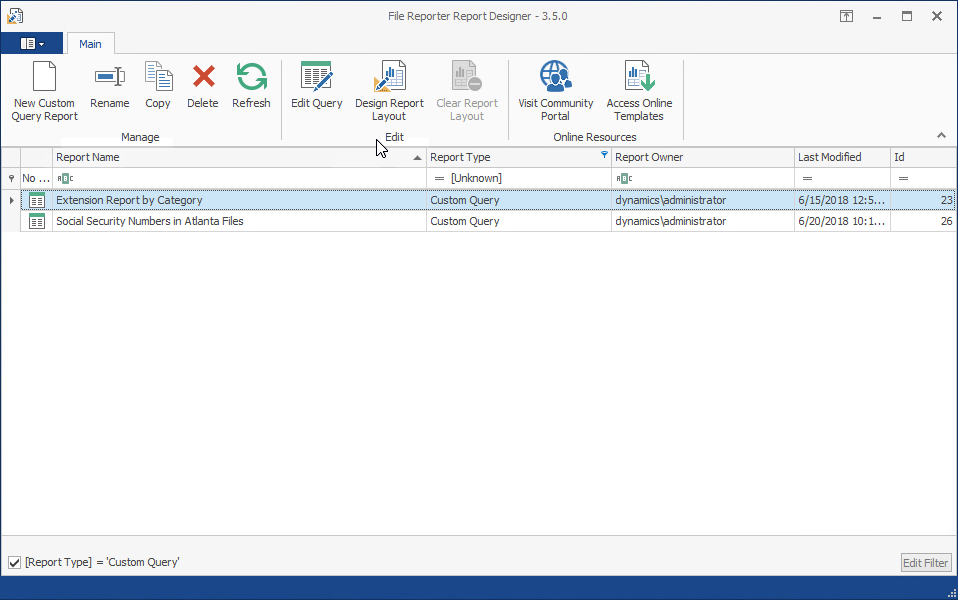
From the listed Custom Query Reports, select the one you want to design.
-
Click .
-
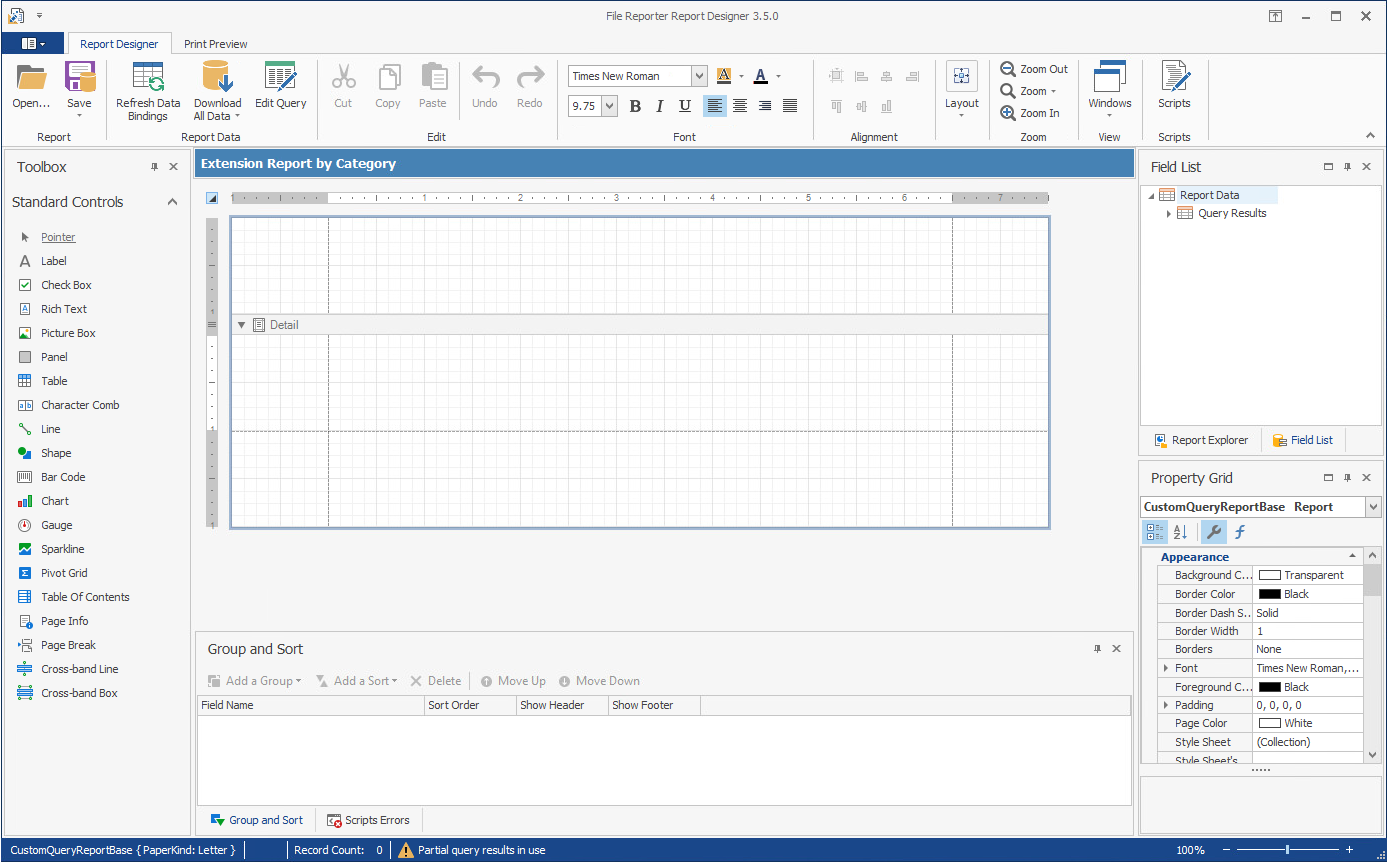
Create a report header.
-
Place the pointer in the upper section of the layout grid.
-
Right click and select > .
A new ReportHeader band appears on the grid.
-
-
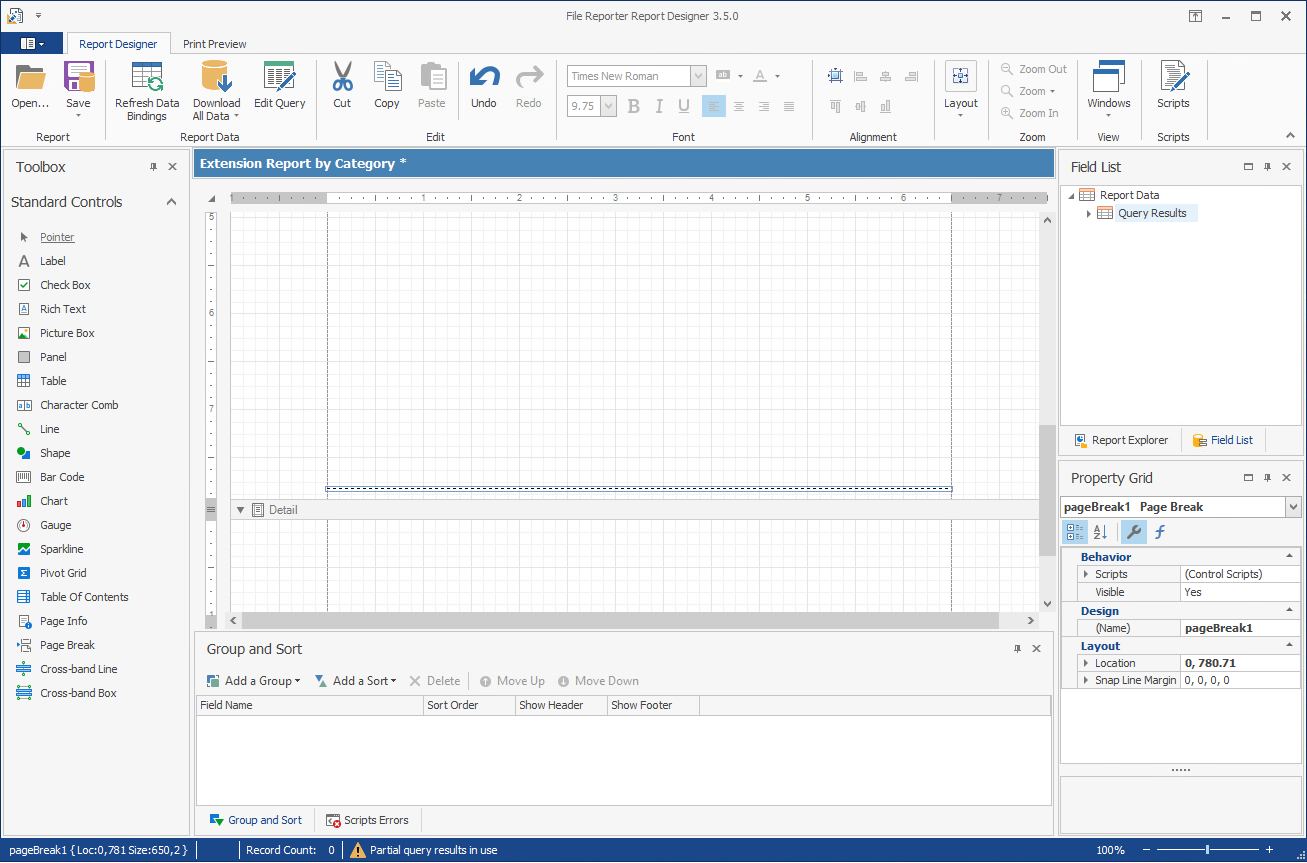
Resize Page 1 and add a page break.
-
Place the pointer on the bottom border of the new band and using the vertical ruler as a guide, extend the band to fill the first page.
For example, to fill the first page, you might extend the border down to the 8" mark.
-
From the region, click and drag a to the bottom of the band.
-
-
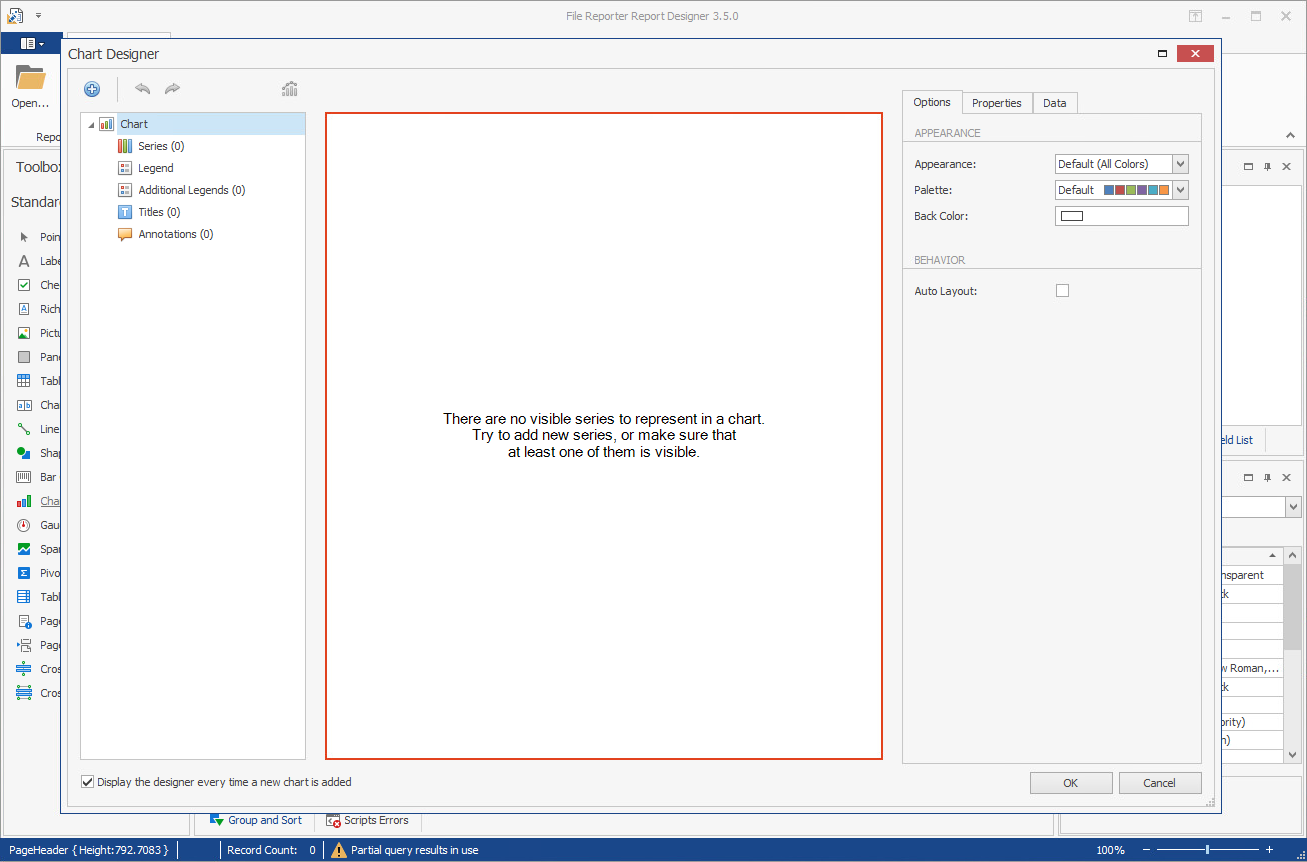
Insert and design a chart.
-
From the region, click and drag a to the band.
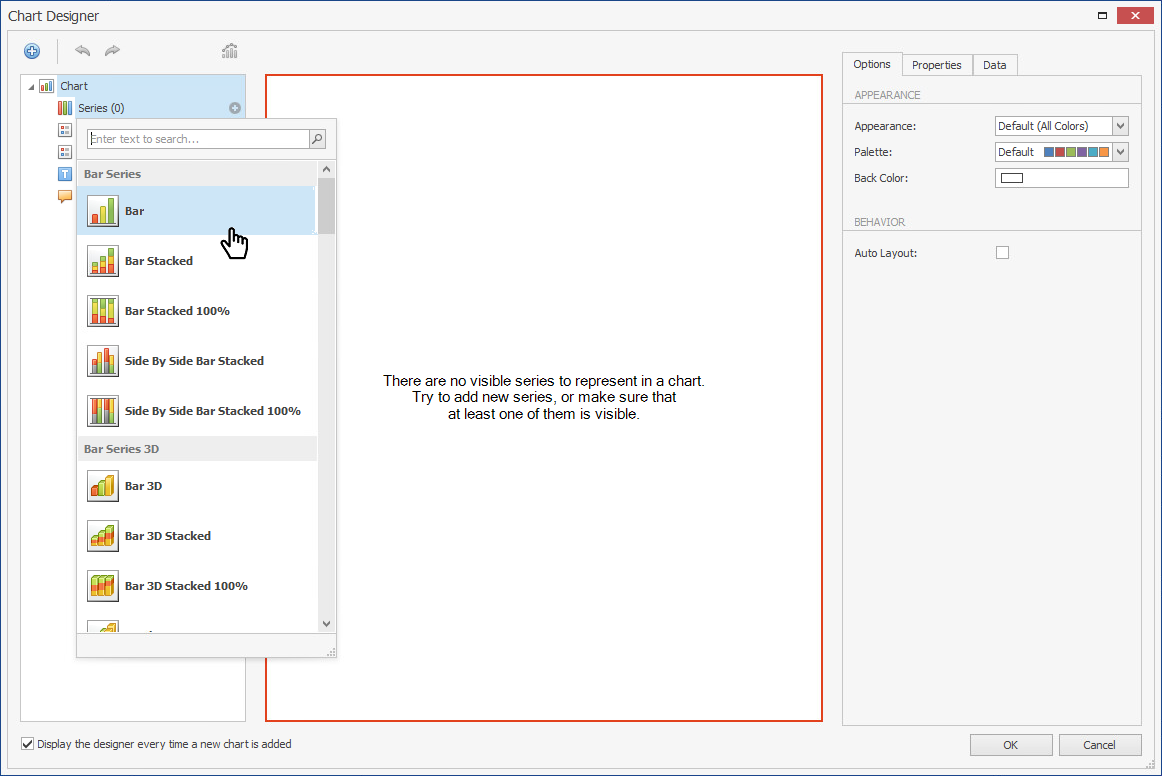
The Chart Designer is launched.
-
In the Chart Designer, below the menu, click the that pertains to the option and select the option.
-
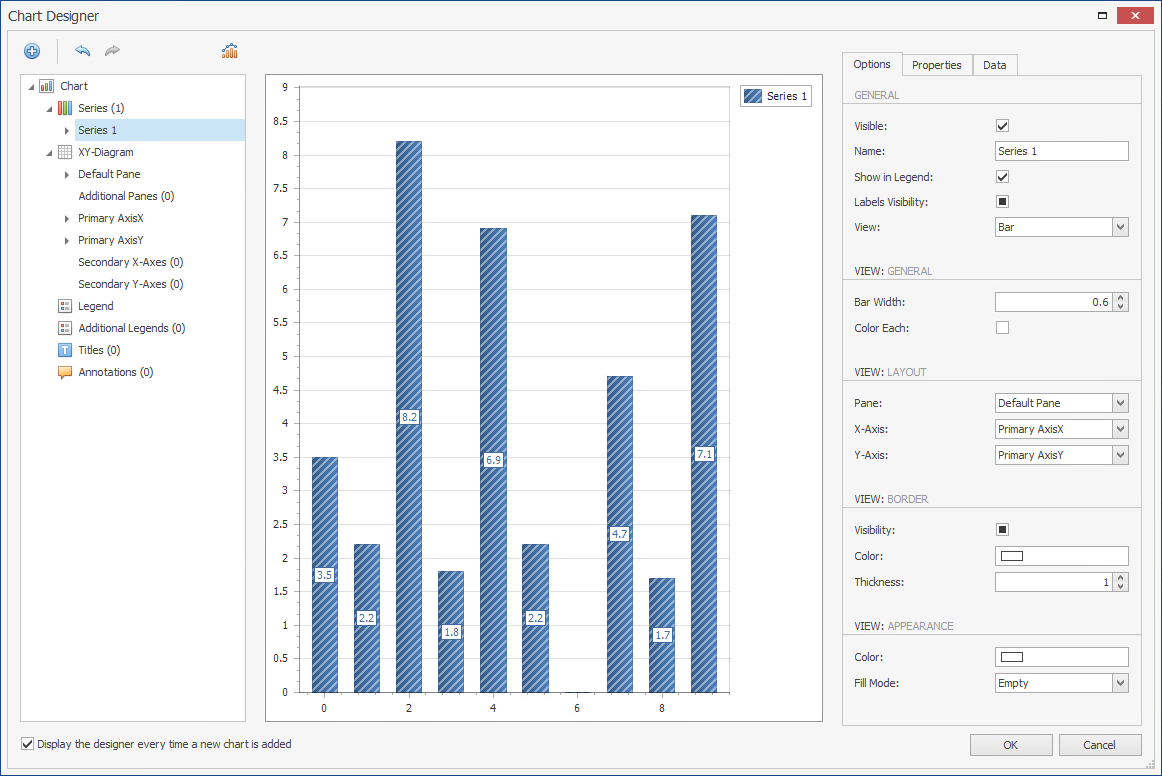
Click the tab and expand .
-
Click and drag to the cell.
-
Click and drag to the cell.
-
Click the tab and in the field, replace Series 1 with Category Size.
-
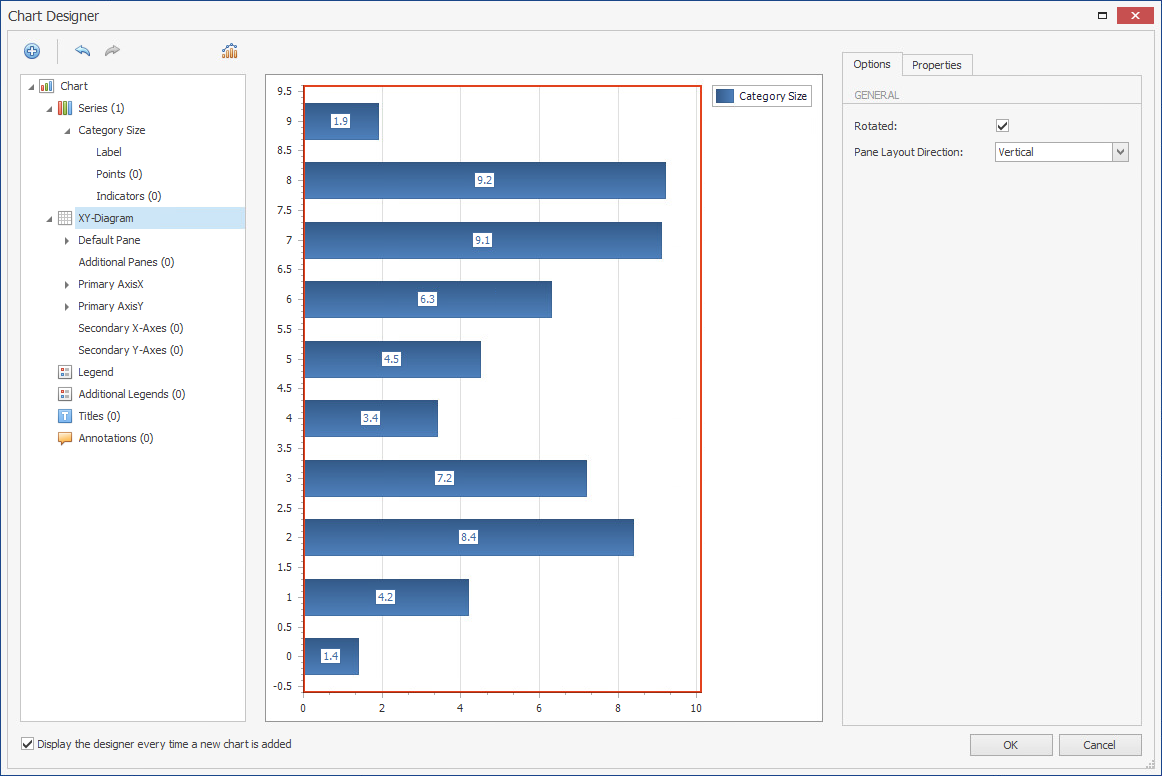
Below the menu, click the option.
-
In the tab, select the check box.
-
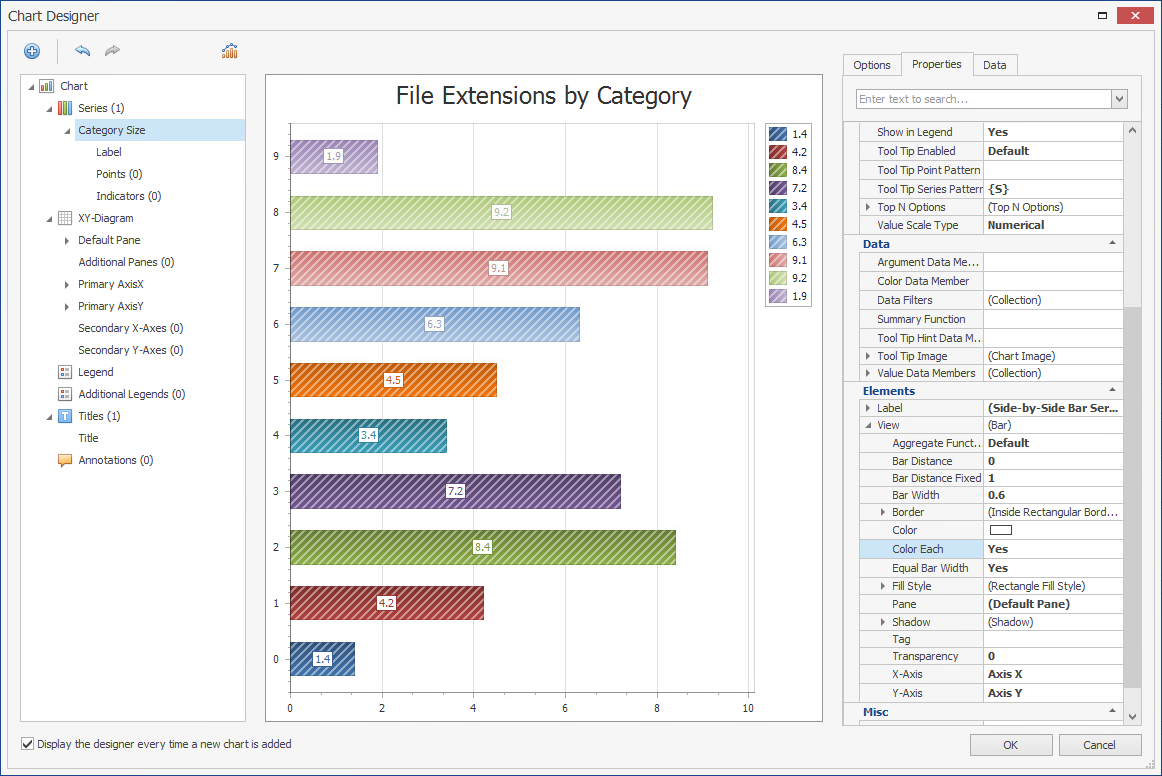
Below the menu, select , click the , and select .
-
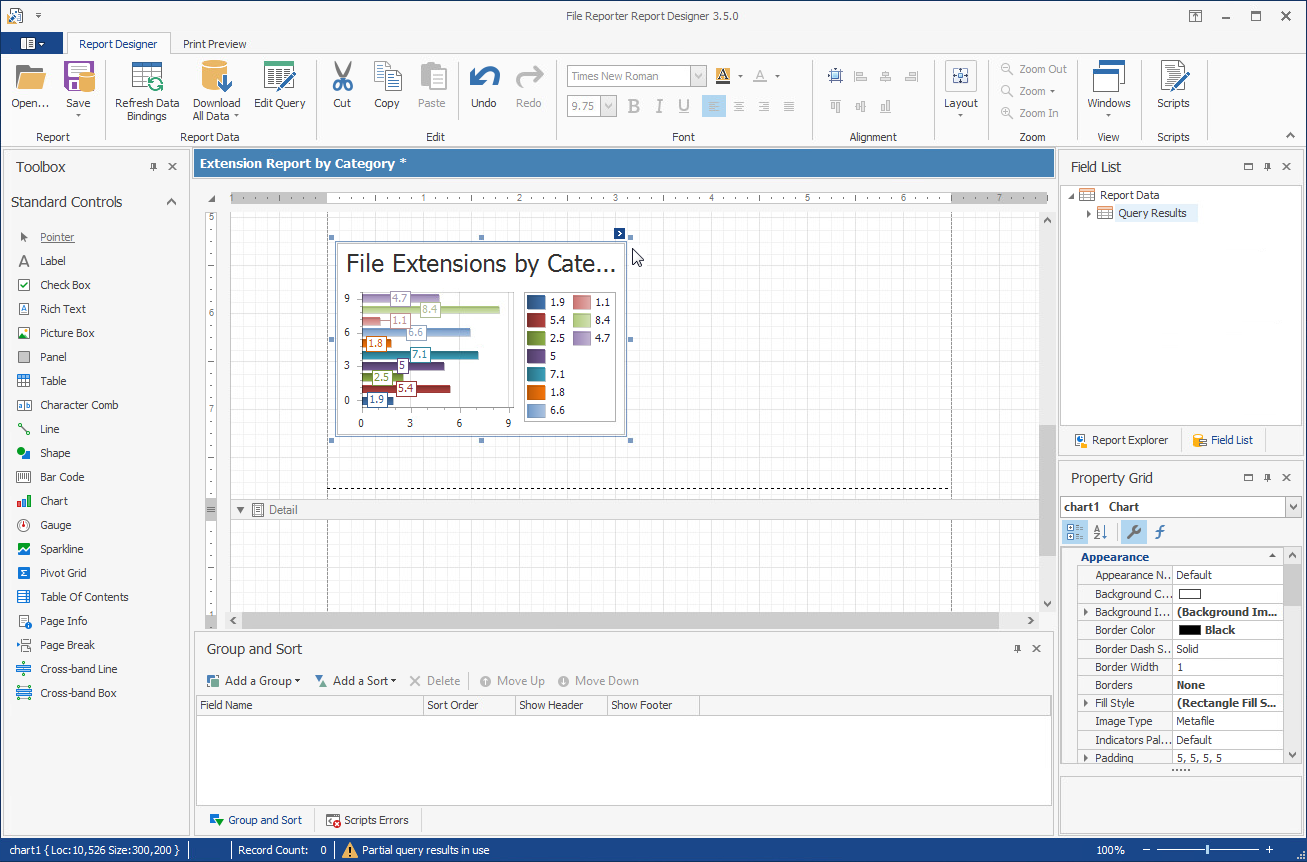
In the tab, in the field, replace Chart Title with a more descriptive name.
For example, File Extensions by Category.
-
Below the menu, select .
-
Click the tab, scroll down and under the heading and expand .
-
Change the setting to .
-
Click .
-
In the upper right-hand corner of the newly-placed chart, click the arrow to access the menu and select .
-
Click the legend and from the tab, deselect the check box so the legend no longer appears.
-
Click .
-
In the Report Designer, expand the view of the chart to take up more of the page.
-
-
Insert labels.
-
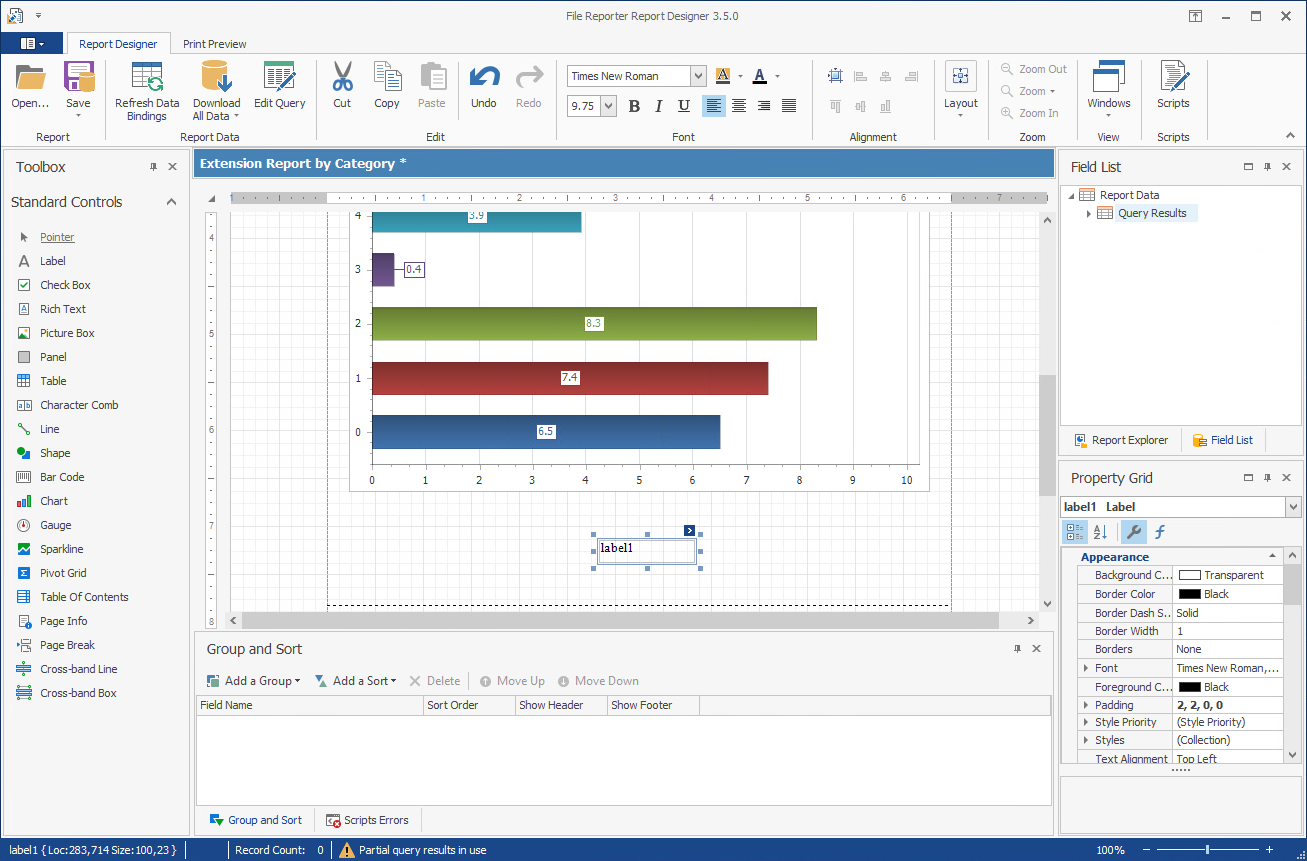
From the Toolbox, click and drag to a position centered below the chart.
-
Double-click within the label and specify the label name.
For example, Total Size.
-
Adjust the font size and style to your preferences.
-
-
Create new fields.
-
From the , expand the .
-
Right-click and select .
-
In the region of the for claculatedField1, change the setting to cfTotalSize.
-
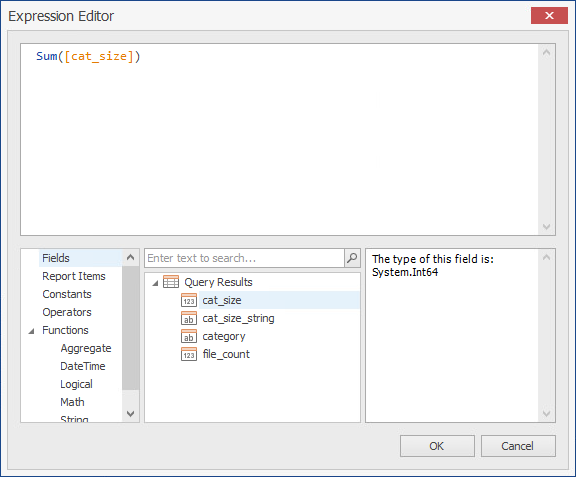
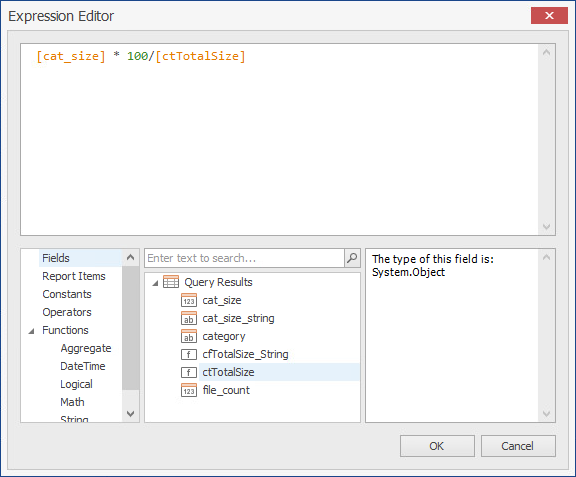
While still in the , under the heading, click the ellipses (...) pertaining to the field.
This launches the Expression Editor.
-
In the bottom-left column, select .
-
In the empty field at the top of the middle column, type sum to locate the function, then double click to place the function in the top text box of the Expression Editor.
-
In the bottom-left column, select and then in the middle column, double-click .
-
Click to save the new filed and close the Expression Editor.
-
Right-click and select .
-
In the region of the for claculatedField1, change the setting to cfTotalSize_String.
-
While still in the , under the heading, click the ellipses (...) pertaining to the field.
-
In the top text box of the Expression Editor, type Byte so that appears.
-
From the middle column, double-click that you created earlier and click .
-
-
Place the new fields.
-
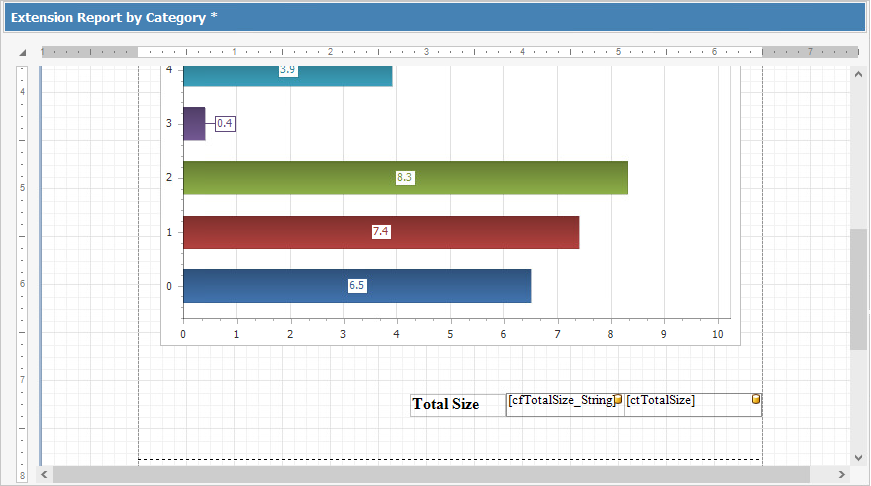
From the , hold down the Control key, select the two new fields you just created, then drag them to the Total Size label on the grid.
-
Adjust the size so that both fields will appear to the right of the Total Size label.
-
Adjust the font size and style to your preferences.
-
-
Preview the report.
-
Click .
-
When the warning dialog box appears, click .
-
Click the tab to observe how the report is going to look at this point.
-
Make any desired format changes.
-
-
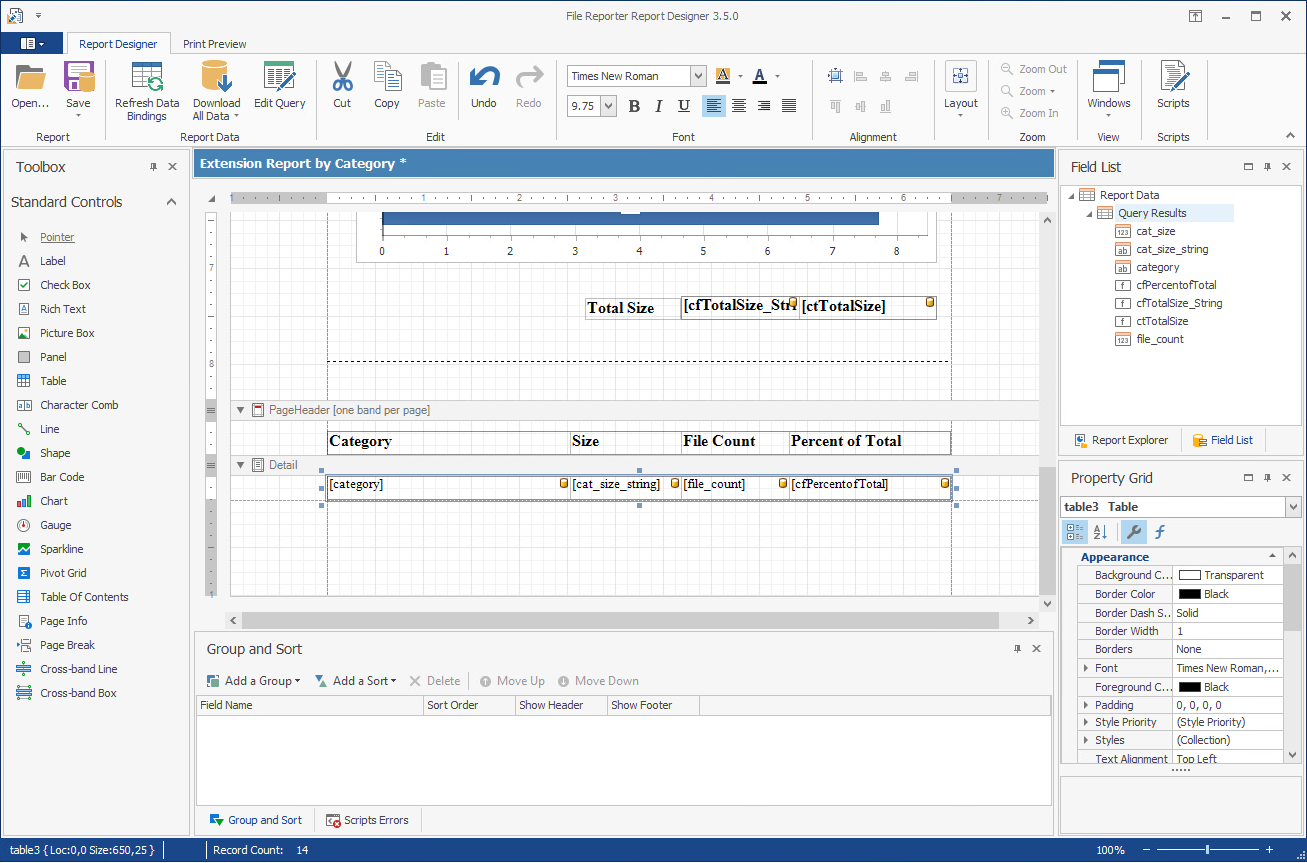
Create a header for Page 2.
-
Click the tab.
-
In the Report Designer, scroll down below the page break so that you are working on Page 2 of the report.
-
At the top of the page, right-click and select > .
-
From the , click and drag a to the location of the new page header.
-
Replace the names of the three new table cells with the following names:
-
Category
-
Size
-
File Count
-
-
Select the File Count cell, right-click, then select > .
-
Change the table cell name to Percent of Total.
-
Resize the table cells to your preferred width.
-
Adjust the font size and style to your preferences.
-
Resize the depth of the page header so it is limited to the depth of the table.
-
-
Create a new calculated field for Percent of Total.
-
Right-click and select .
-
In the region of the for claculatedField1, change the setting to cfPercentofTotal.
-
While still in the , under the heading, click the ellipses (...) pertaining to the field.
-
From the middle column of the Expression Editor, double-click .
-
Hit the space bar and then enter the following string: * /100
-
Complete the string by double-clicking from the middle column of the Expression Editor.
-
Click .
-
-
Insert the table content.
-
Click below the header, hold down the Control key, and from the , select the following fields in this order:
-
category
-
cat_size_string
-
file_count
-
cfPercentofTotal
-
-
Drag the fields to a location below the header.
-
Line up the tables cells with the headings.
-
Click the tab to view how the report will look.
-
Make any needed adjustments.
-
-
Click > .
By saving the report to the database you enable the File Reporter Report Generator to use the report design for updated reports.
In addition to saving the report to the database, you can save the report as a file where you can import it into another file, such as a Word file or PowerPoint presentation.