4.4 System View
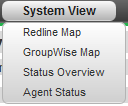
Redline’s System View shows all known agents in your GroupWise environment.
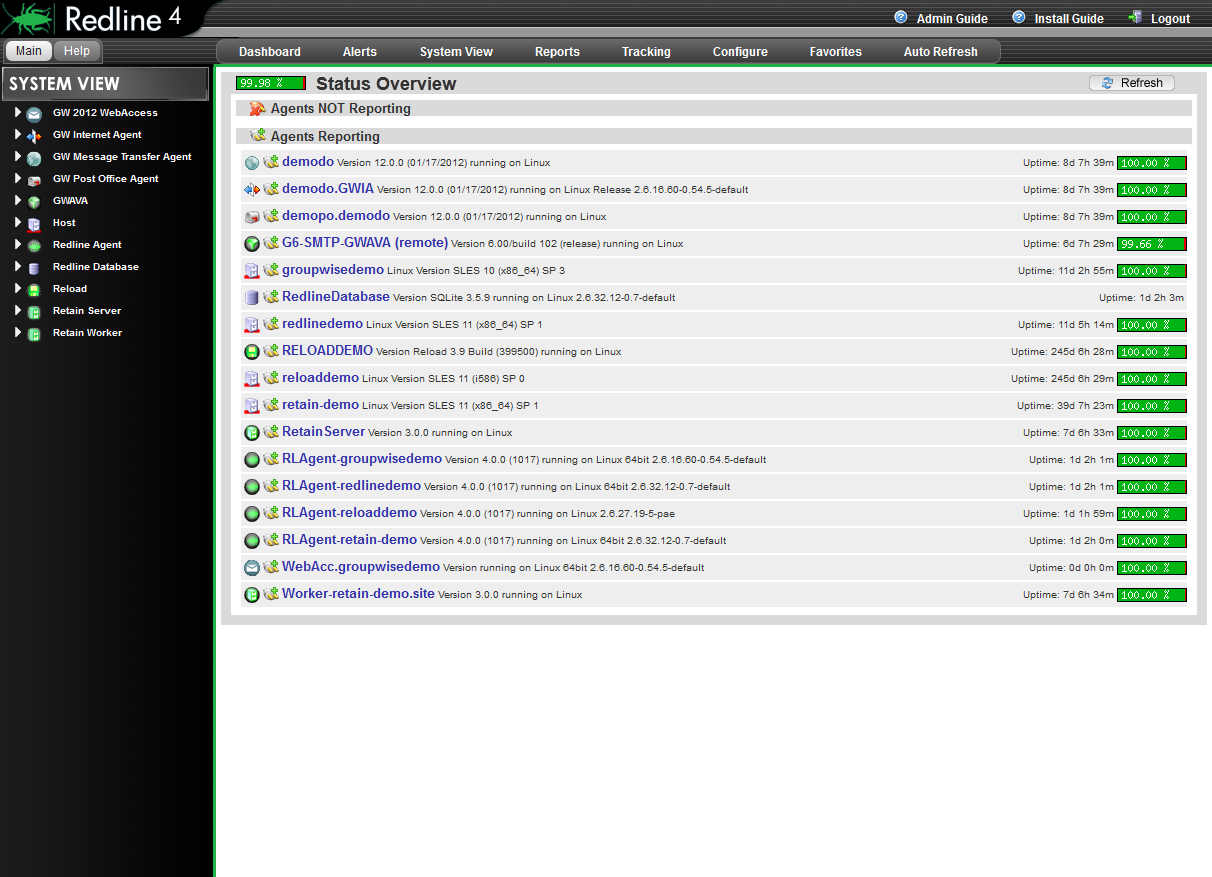
On the main Status Overview page, you can see the version, uptime, platform where the agent is running on and a couple of other values. If you click on one of the agents you are taken to that agent’s page, where Redline displays all known settings, status values, graphs, etc. in detail.
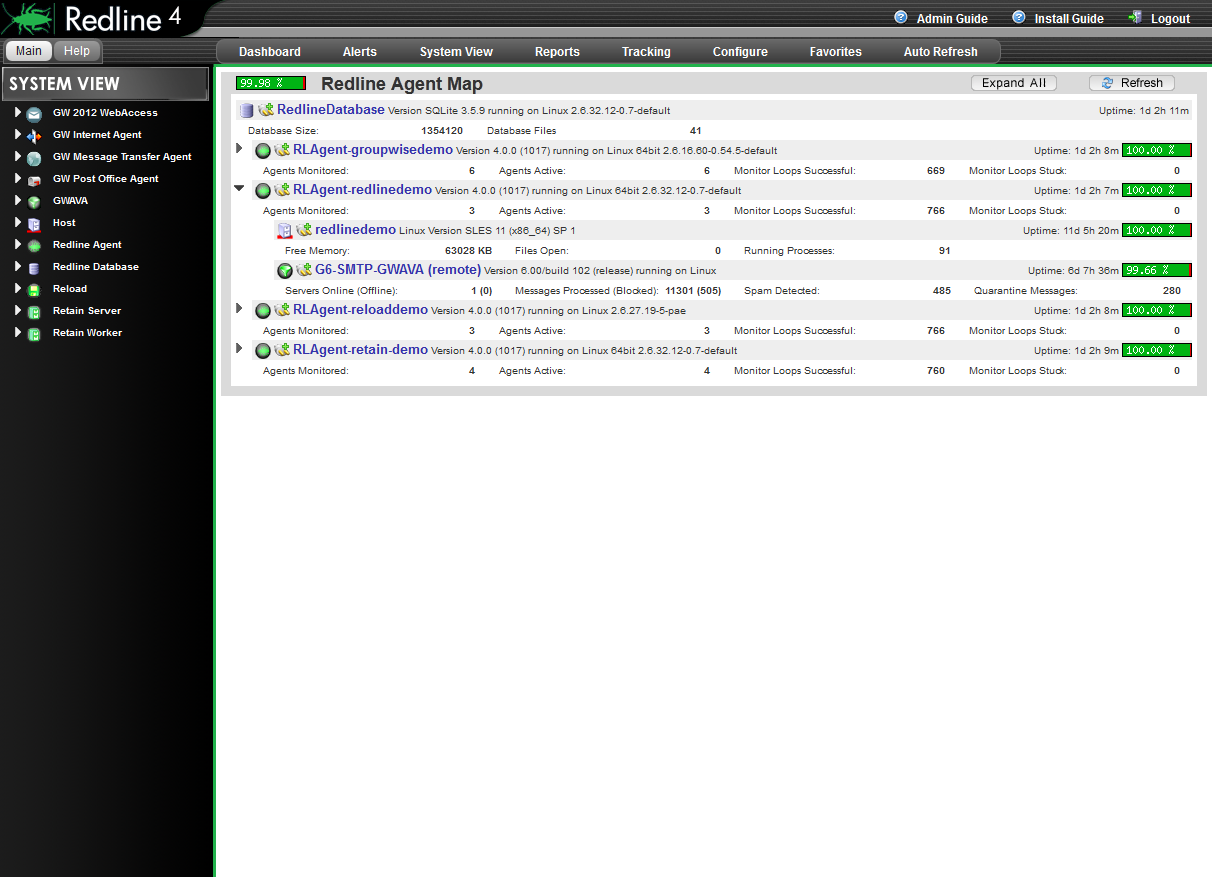
The Redline Map page allows you to see which agents a Redline Agent is monitoring, or which server they are on. These views will not be of large benefit if remote monitoring is being used.
The plug icon indicates if an agent is actively reporting data or not. If you mouse over the plug, a small window appears showing when the agent last reported any data. Wherever you see a “plug” icon in Redline, you can mouse over it, pause a second, and this information is displayed.

4.4.1 Menu
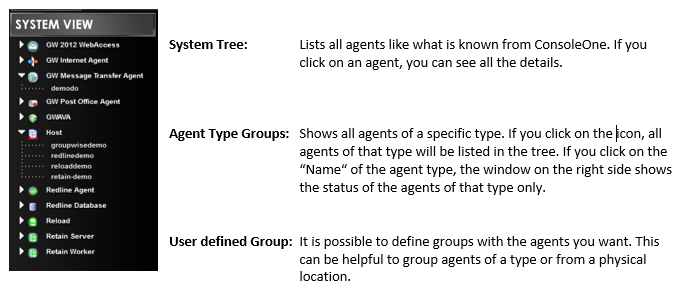
The menu contains the System Tree which looks like what you are familiar from ConsoleOne. All agents of a type can be listed by clicking on the row with the agent type, and you can define your own groups. In the group, only the agents you want will be shown.
How to define a Group
-
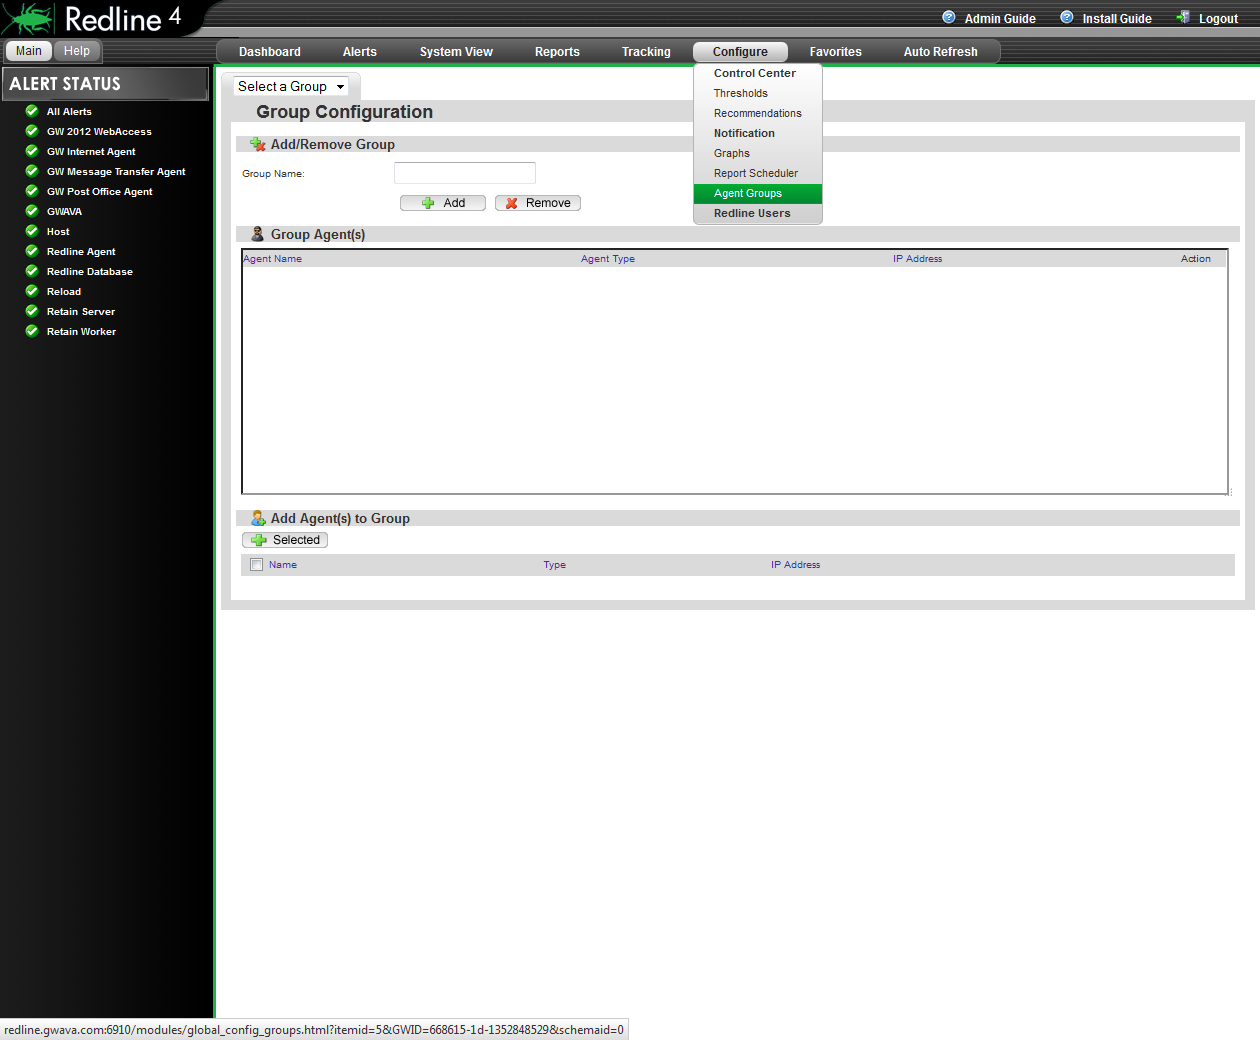
Select Agent Groups from the Configure drop-down menu.
-
Specify a Group Name and click “Add”
-
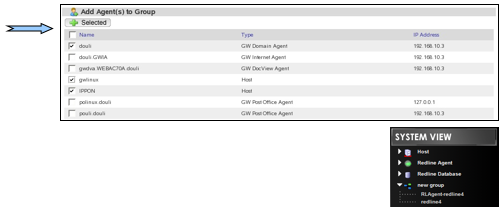
Mark the agents you want in this group and click “+ Selected”
-
Browse back to System View
-
Click on the group in the menu
You can add or remove agents to user defined groups at any time.
4.4.2 Viewing an Agent
Everywhere where you click on an Agent Name in Redline you will see the details from the System View. It doesn't matter where you click on the agent name (Dashboard, Alerts List, and System View). Every agent has information on 8 different pages.
-
Summary
-
Status
-
Settings
-
Alerts
-
Reports
-
Graphs
-
Configure
-
Manage
These pages can be accessed from the menu.

4.4.3 Summary
The Summary page is unique to every agent in Redline. The summary page is used to display the most important status values and settings for an agent on a single page.

Status: The status icons indicate if a threshold or recommendation is defined for the value and if the value is in the defined range or not. The icon depends on the severity of the defined threshold or recommendation.
Trend: A trend is indicated if a value is generally going up or down for at least 10 points of measurement, and not simply an indication of a simple change. A single high or low peak is also not enough to force the 'trend' in a direction. Instead, a generally significant and overall movement in one direction is required to cause a 'trend'.
4.4.4 Status
The status page shows all values which can change during normal operations. Examples are “Users Connected”, “Messages Sent”, “Threads available” etc. Redline collects these values from many different sources and presents them on a single page.
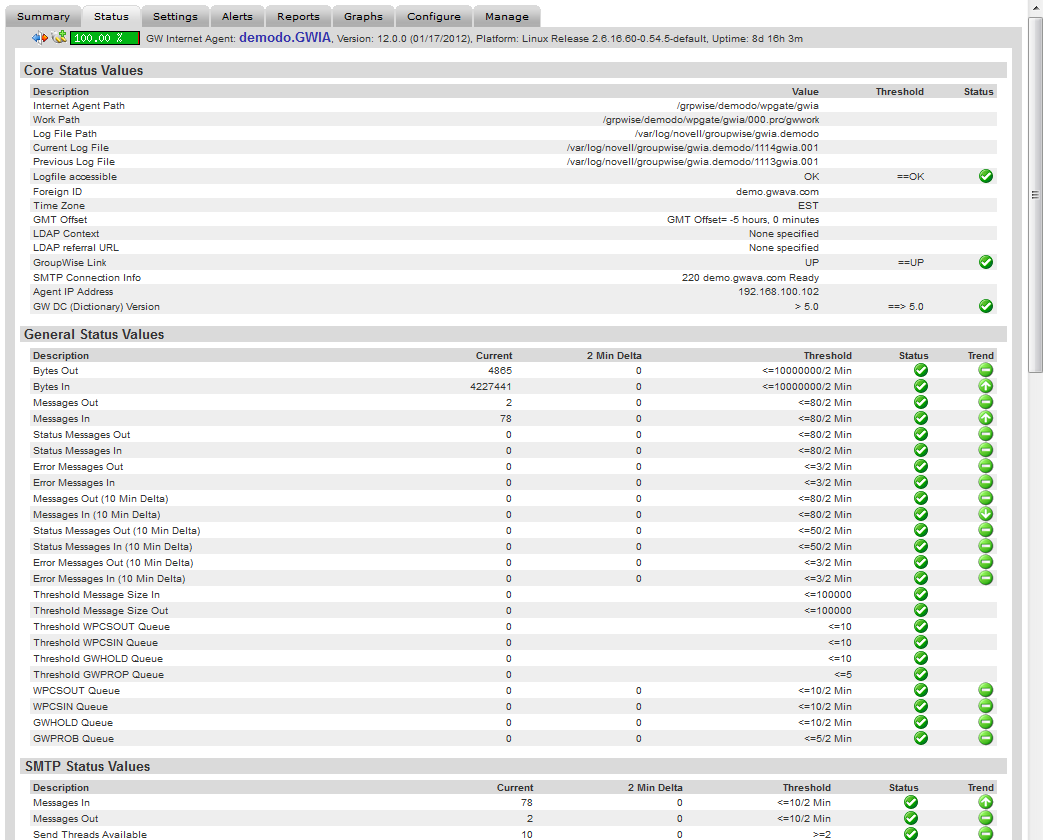
For some agents like the Post Office, Domain or Internet Agent, the file system is monitored, and the number of files, the size of all files, the oldest, and the largest file are presented.
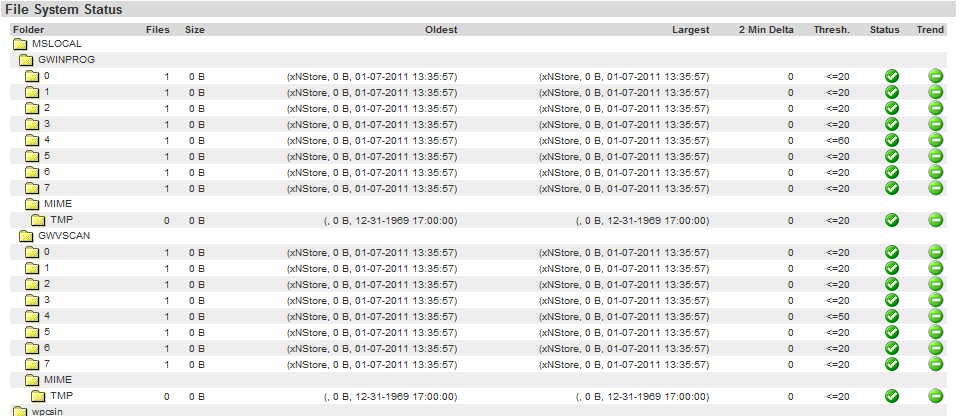
You can define thresholds for the number of files, size of the folder, largest and oldest file. By default thresholds are defined to make sure not too many files are in the folder. If a folder is queuing up, usually a problem exists in your GroupWise system.
4.4.5 Settings
The settings page shows configuration settings appropriate to the monitored agent. The recommendation, threshold and status shown here are based on the current GroupWise best practices and defaults. The recommendations and thresholds can be changed to accommodate your installation. See how to configure a threshold or recommendation to change recommended and threshold values.
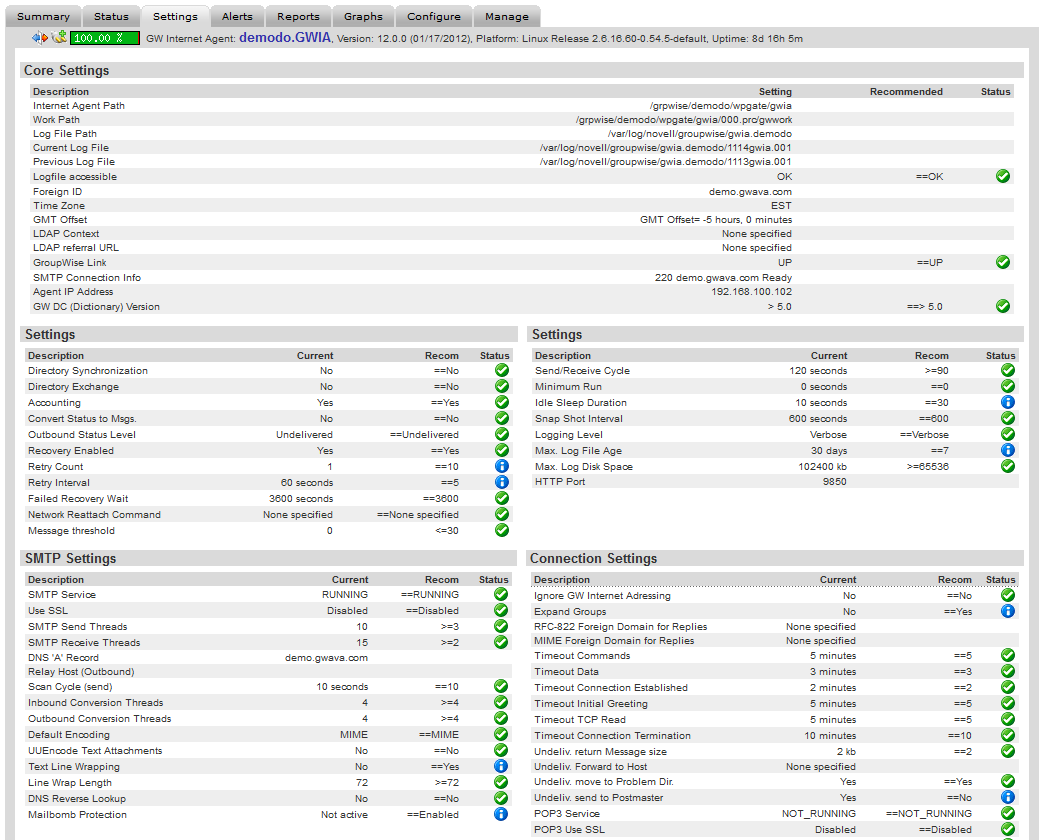
Redline and GWAVA Reload agents can be managed in part from this page. Click the 'OK' button to save any changes made. The Agent Actions allow for a seamless way to update the Redline Agent software. (See the Online Update section.) Unloading an agent requires the agent to be started again from the server it resides on. Removing an agent unregisters the selected agent from the Redline Control Center.
4.4.6 Alerts
On the agent specific alerts page, all alerts for the agent are listed. All solved alerts, including date and time when the problem was solved, are also listed. You can delete and mark alerts as solved from this page.

Reports
All reports which can be run on the selected agent type may be run from this page. To learn more about report definitions and designing reports, refer to the next chapter.

To run a report listed on this page, select the report name. Selecting a report name will open a new window with the selected report generated in the browser page.
4.4.7 Graphs
Graphs are a very powerful tool to look at data in a visual way. Graphs show how disk size grows and shrinks, memory is allocated over time, or an abnormal amount of message traffic. All these kinds of graphs can be defined and the agent specific ones can be shown on this page.
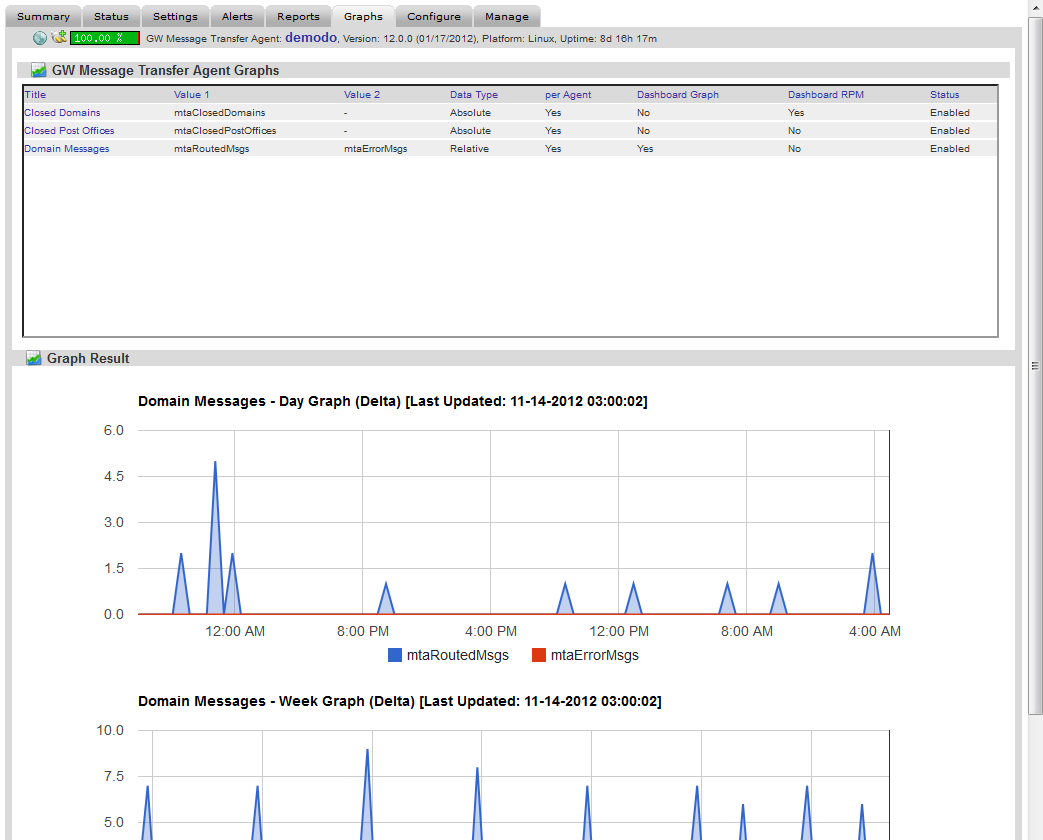
For Graph explanation see the Graphs section.
4.4.8 Configure
It is possible to define thresholds, recommendations and graphs which will be used for only the selected agent. Sometimes it is necessary to have different thresholds and recommendations for some or just one agent. Configure the thresholds and recommendations here.
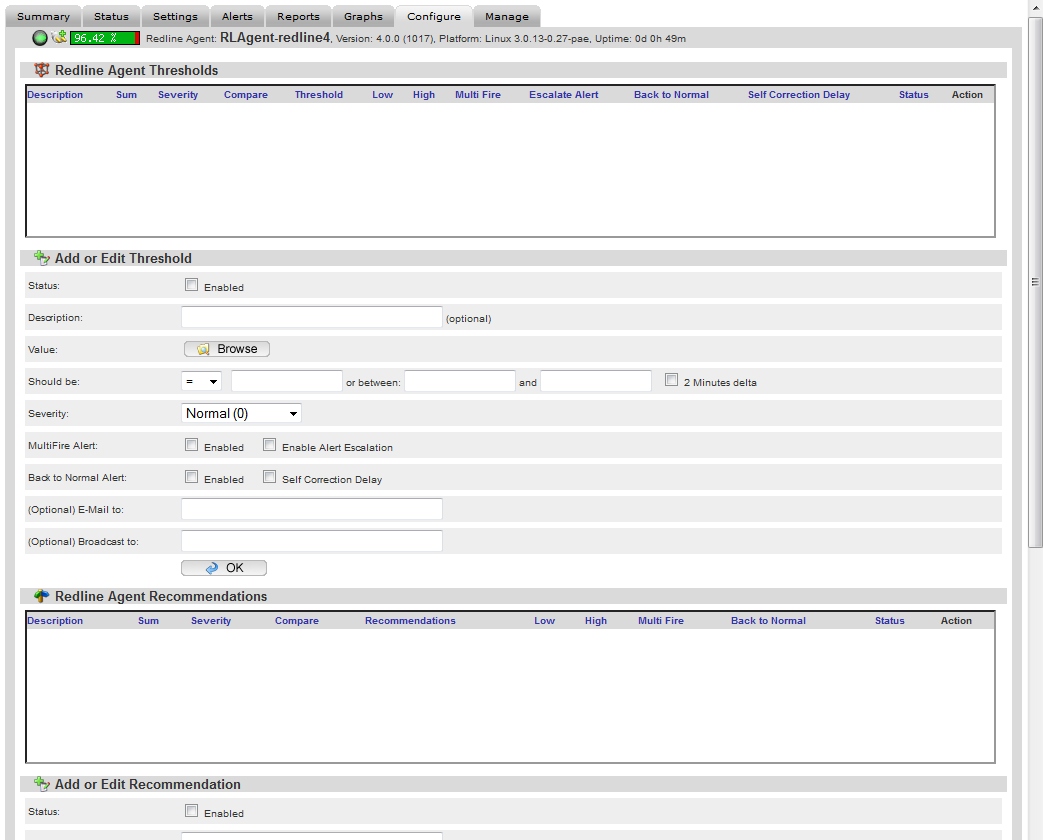
Many values are already defined in the 'browse' button. Name the threshold desired and then select the desired value from the 'browse' menu. To select a value, click on the action icon in the right column.
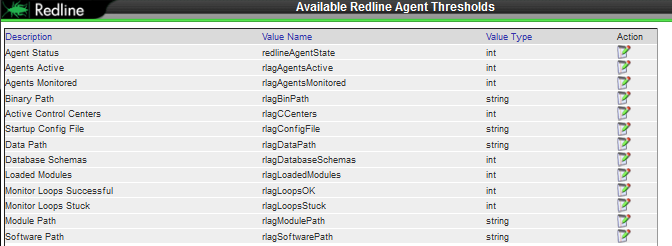
(The value and the name have been set the same for simplicity in the example.)
Specify the desired threshold level and click 'OK' to save the new threshold. Remember, a threshold or recommendation will not be active unless it is enabled.
4.4.9 Manage
While every agent has a manage tab, only Redline Agents allow configuration. From the manage tab you can configure all agents monitored by the selected Redline agent or add new agents to be monitored.
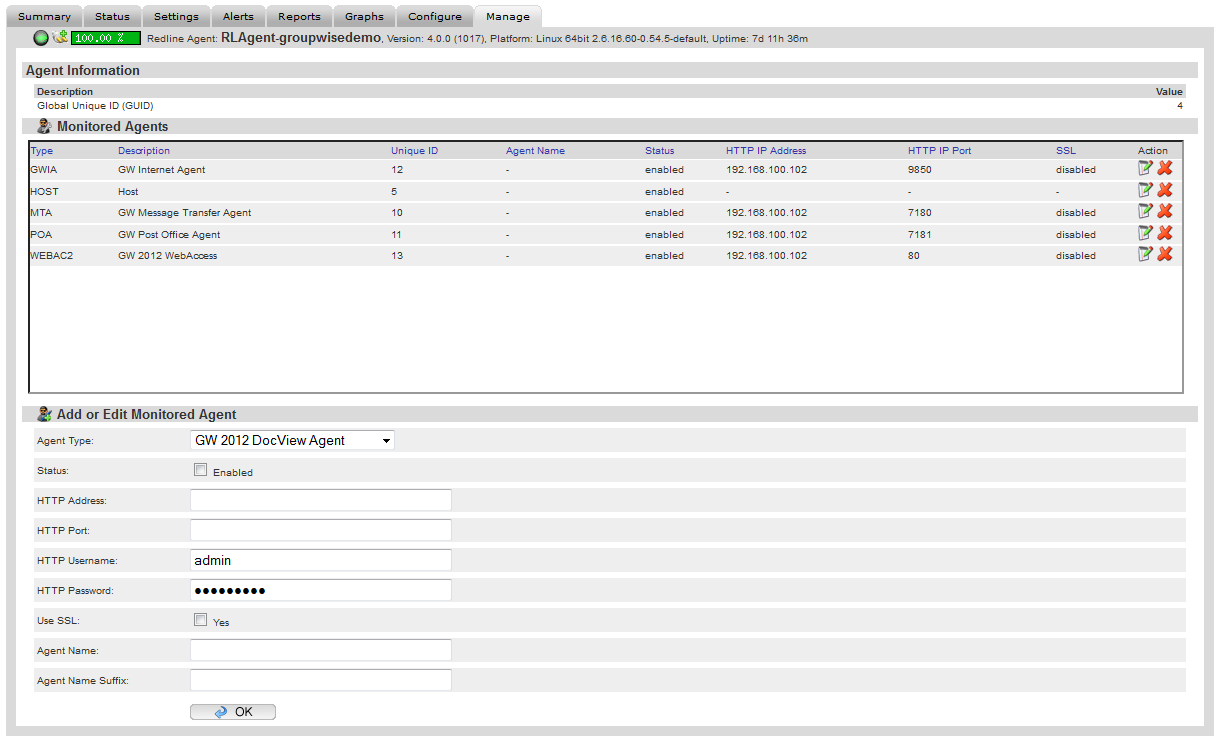
For details about how to manage all the monitoring features, please refer to the Redline Installation Guide.
All other agents, (monitored agents), can be removed from the Redline system from this page once they have first been removed from the Redline Agent’s page. If they have not been removed from the agent’s page first, when the agent again reports the data, the removed item will be re-created and replaced.

If the displayed agent is a monitored agent, the registering agent’s ID value listed on the right side of the page will link directly to the registering agent’s page.
4.4.10 GroupWise Map
The GroupWise map tab under the System View displays the monitored system in a top-down map showing how components in the GroupWise system are connected and their hierarchy.

Basic vital statistics for each monitored agent and overall percentage uptime are displayed.
4.4.11 Redline Map
The Redline Map displays all agents in the system monitored by a Redline Agent. The monitored agents are displayed beneath their parent Redline Agent.
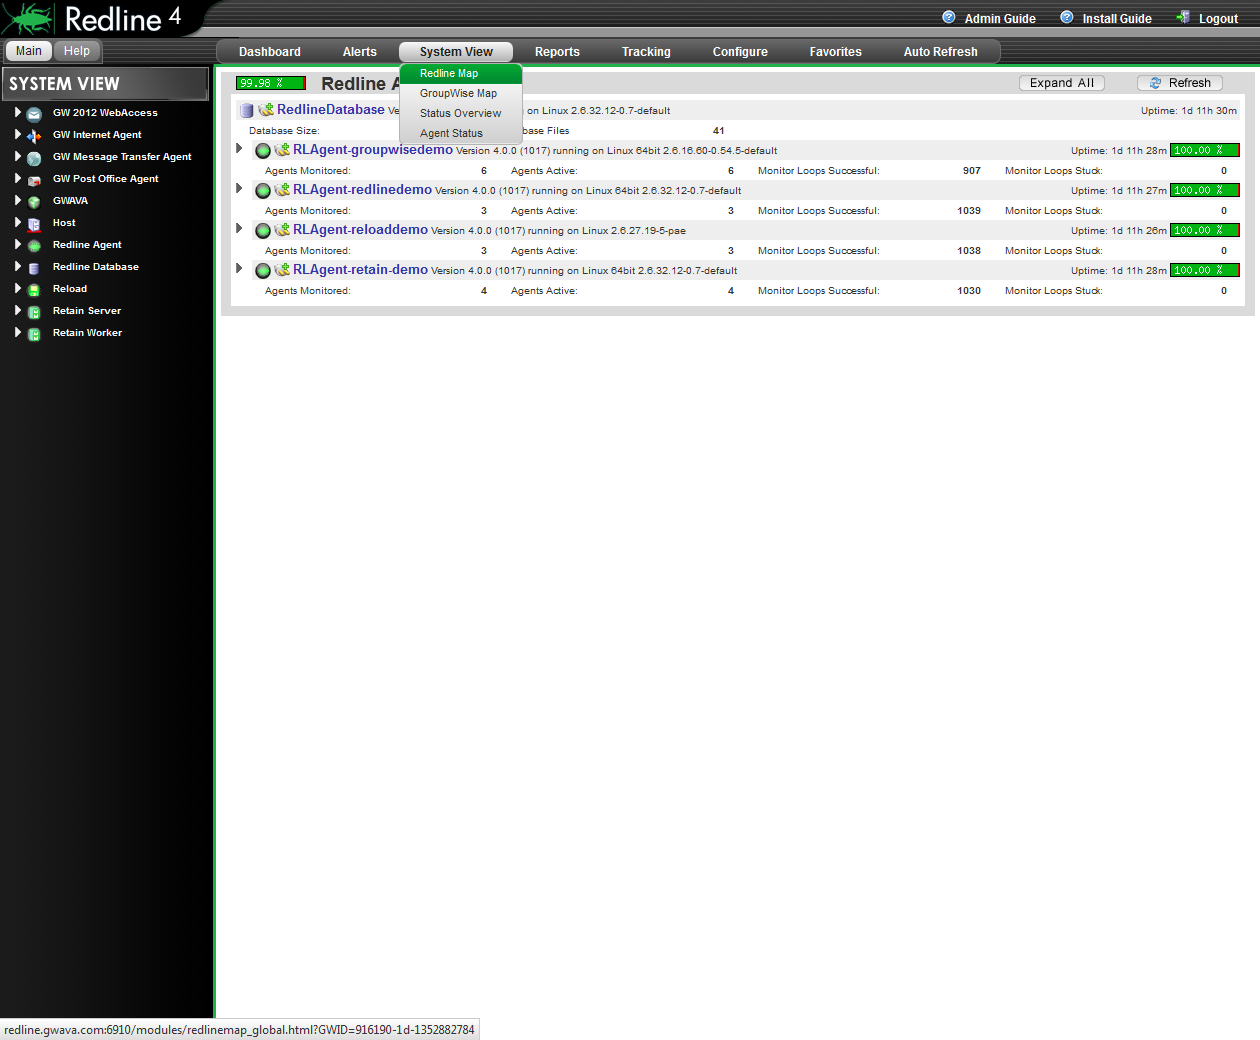
Uptime, basic vital statistics for each monitored agent, and overall percentage uptime are displayed. The Redline Agent Map is a quick and easy tool to visualize and track down outages in a system. Select the ‘expand all’ button to display the Redline agents which are being monitored. How the agents are displayed depends on user configuration. Agents may be organized per alphabetical, host, Redline UI, or agent Grouping
4.4.12 Agent Status
The Agent Status page displays all the different agents and monitoring agents along with their status. The Agent Status page is intended to create a single display containing the essential information for the entire monitored Redline system.

Essential statistics for the different agents and servers including free memory, system uptime, percentage of total uptime reported, vital stats, and even stuck monitoring loops for present agents are reported.