4.5 Reports
With reports, you can get a lot of information out of your GroupWise environment. Redline provides many preconfigured reports spanning every monitored agent in the system. Custom reports tailored to any specific need or organization also can be created. To quickly facilitate access to the information that Redline gathers, Redline ships with many predefined reports.
All reports require that the Redline agents must have file access to monitored agents and systems. The reports require access to files, logs, and additional information stored on the host server for each monitored system. It is best to run a Redline agent on each server running a monitored agent to provide accurate results.
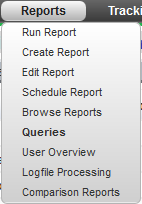
4.5.1 Run Reports
The Run Reports page contains all the pre-defined and configured reports which ship with Redline 4. Though these reports are included with Redline, any newly defined or user-created and saved reports will be listed here as well. The displayed reports may be filtered by the desired component selected on the left under ‘Global Reports’.
Reports here may also be filtered to specific agents or time frames for the reported data. To run a report on a bloated post office, click on GW Post Office Agent in the list on the left panel. Set the beginning date to last week, select the bloated post office agent in the Agent Name list, and then click on the report name to run the report.
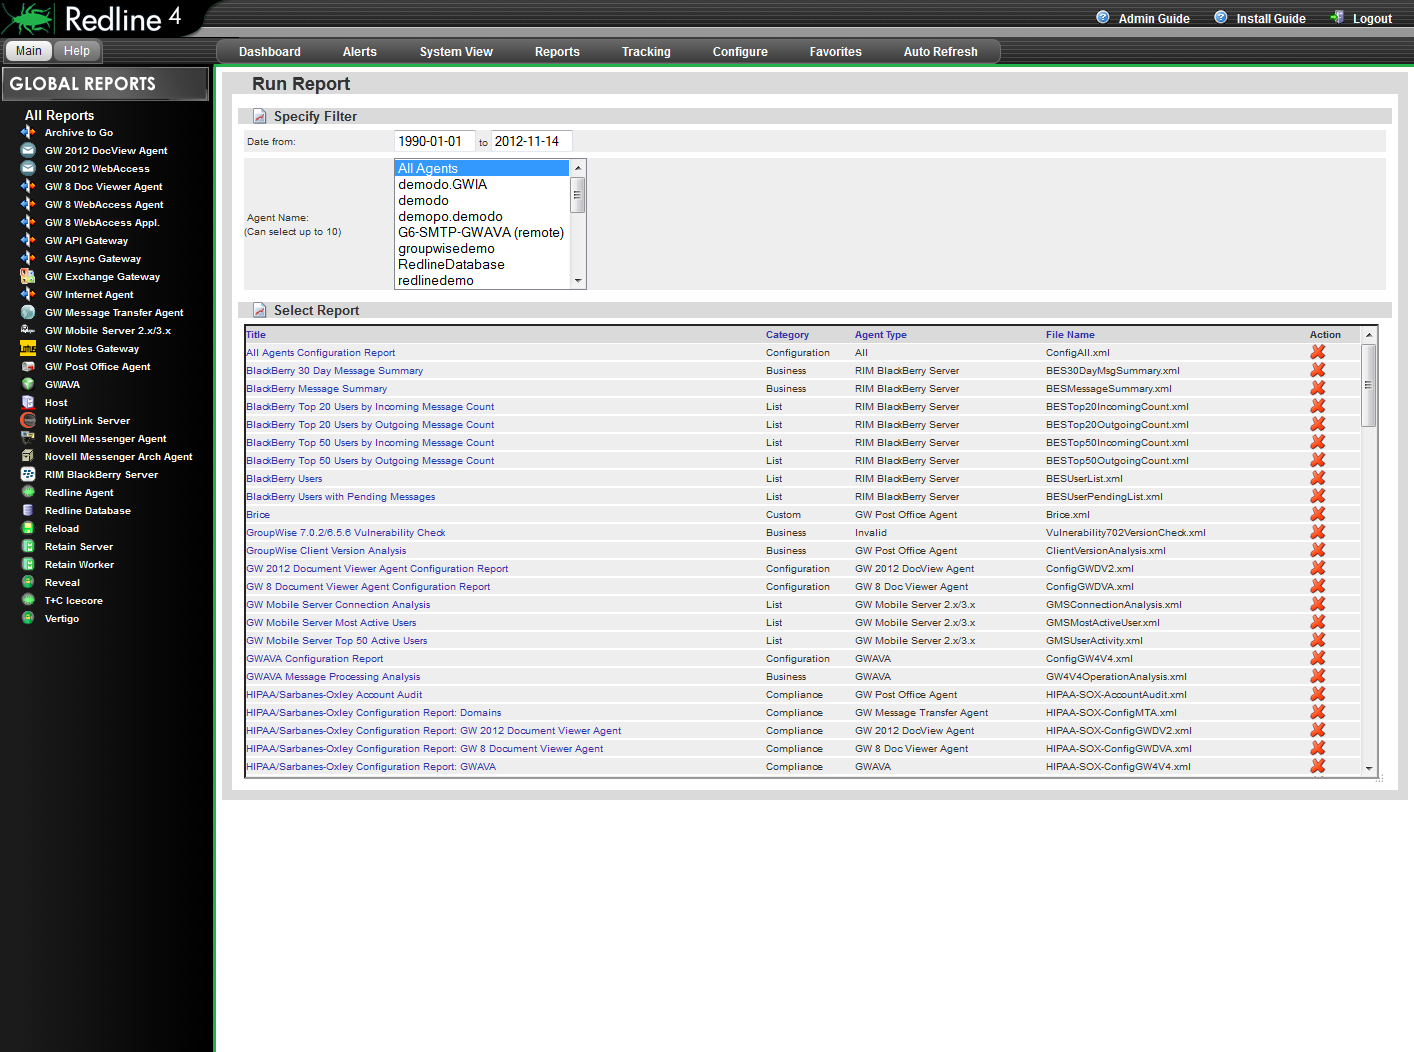
4.5.2 Create Report
Reports can be created and customized to any situation. To create a custom report, first select a table from the left-hand menu. Give the report a title and filename but do not use spaces in the file name. A customized text header should also be added to provide explanation for the report.
Once the title and text header have been entered, then exactly what data is to be displayed along with how it will be displayed must be selected. The chart type, columns to display in the chart, how the data is grouped, and the specific column utilized as the column to track the changes in as well as how the information should be sorted are all required.
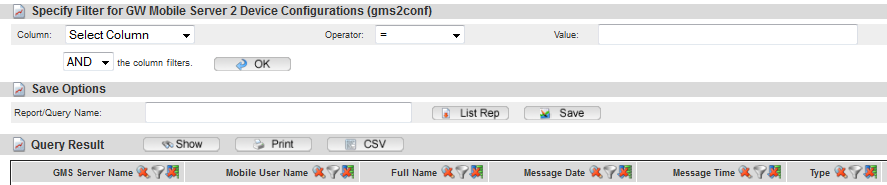
The Query Definition section is used to further filter the data. The four criteria locations can either be left blank, or filled-in as desired. The filters may be created with a logical ‘and’ or ‘or’ to truly hone the report to only the desired criteria.
Once finished, a custom report cannot be previewed before it is saved. Select the ‘Save’ button to allow the ‘preview’ button to spawn a new window and display the results. Do not close the report creation window, as you may return and modify the report, re-save, and re-preview the report until it meets satisfaction. Ensure that it is saved, then schedule or immediately run the report through the Run Report window.
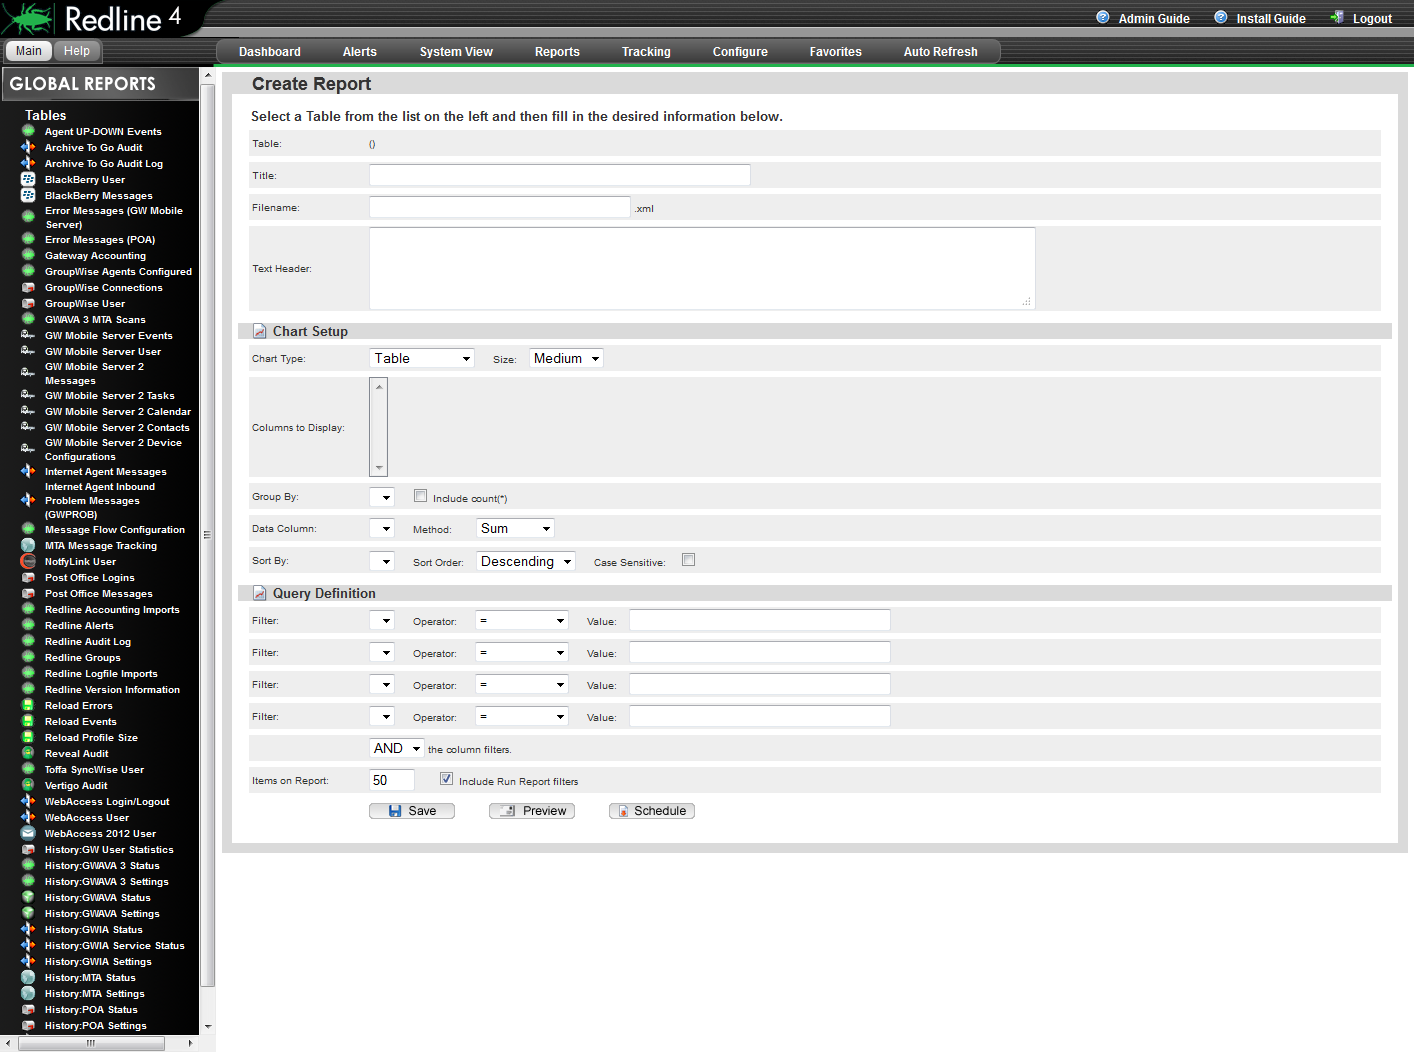
4.5.3 Edit Report
Existing reports may be edited through the Edit Report page. To edit a report, select an agent to restrict the listed reports to choose from. Simply select the name of the report desired to load it into the editor.
Once loaded, the report then can be edited directly in the HTML Template window. If editing a report that came with Redline, it is recommended to give it a custom file name as well as template name, to avoid overwriting the original report. Select ‘OK’ when complete to save the edited report.
4.5.4 Schedule Reports
The report Scheduler is accessed through the Configure | Report Scheduler drop down menu.
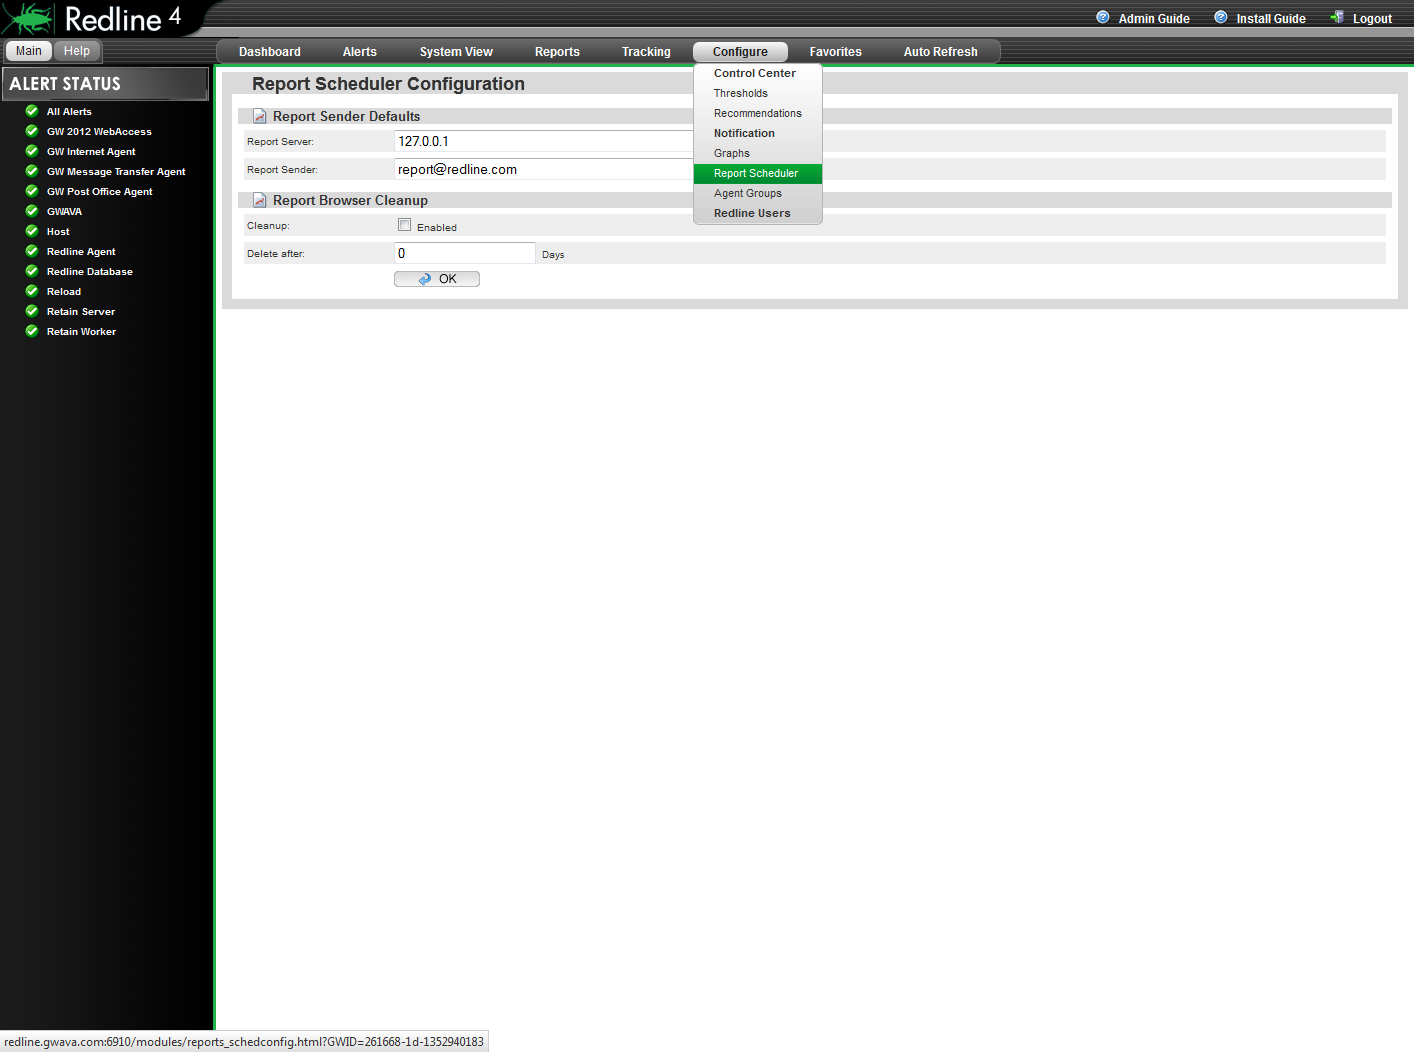
To get a scheduled report run and sent to the desired recipient, the scheduler needs to be configured first.
The Report sender default is the source server for information loaded in the report, but not sent, in the report email. The default setting is 'home', 127.0.0.1, but for the embedded graphs and tables to work, this section MUST be set to the Redline Control Center's IP address.
To view reports from outside the network, the IP/DNS address must be publicly accessible, and port 6910 needs to be forwarded to the Redline Control Center server.
The browser cleanup option removes all saved embedded graphs and information from the Redline server after the specified amount of days. It is not enabled or set by default as saved reports are system specific. For example, if a system has daily reports, it is not recommended to save a full year of reports for the sheer number, yet monthly reports may need to be saved for a year. Select a setting which works best for the system.
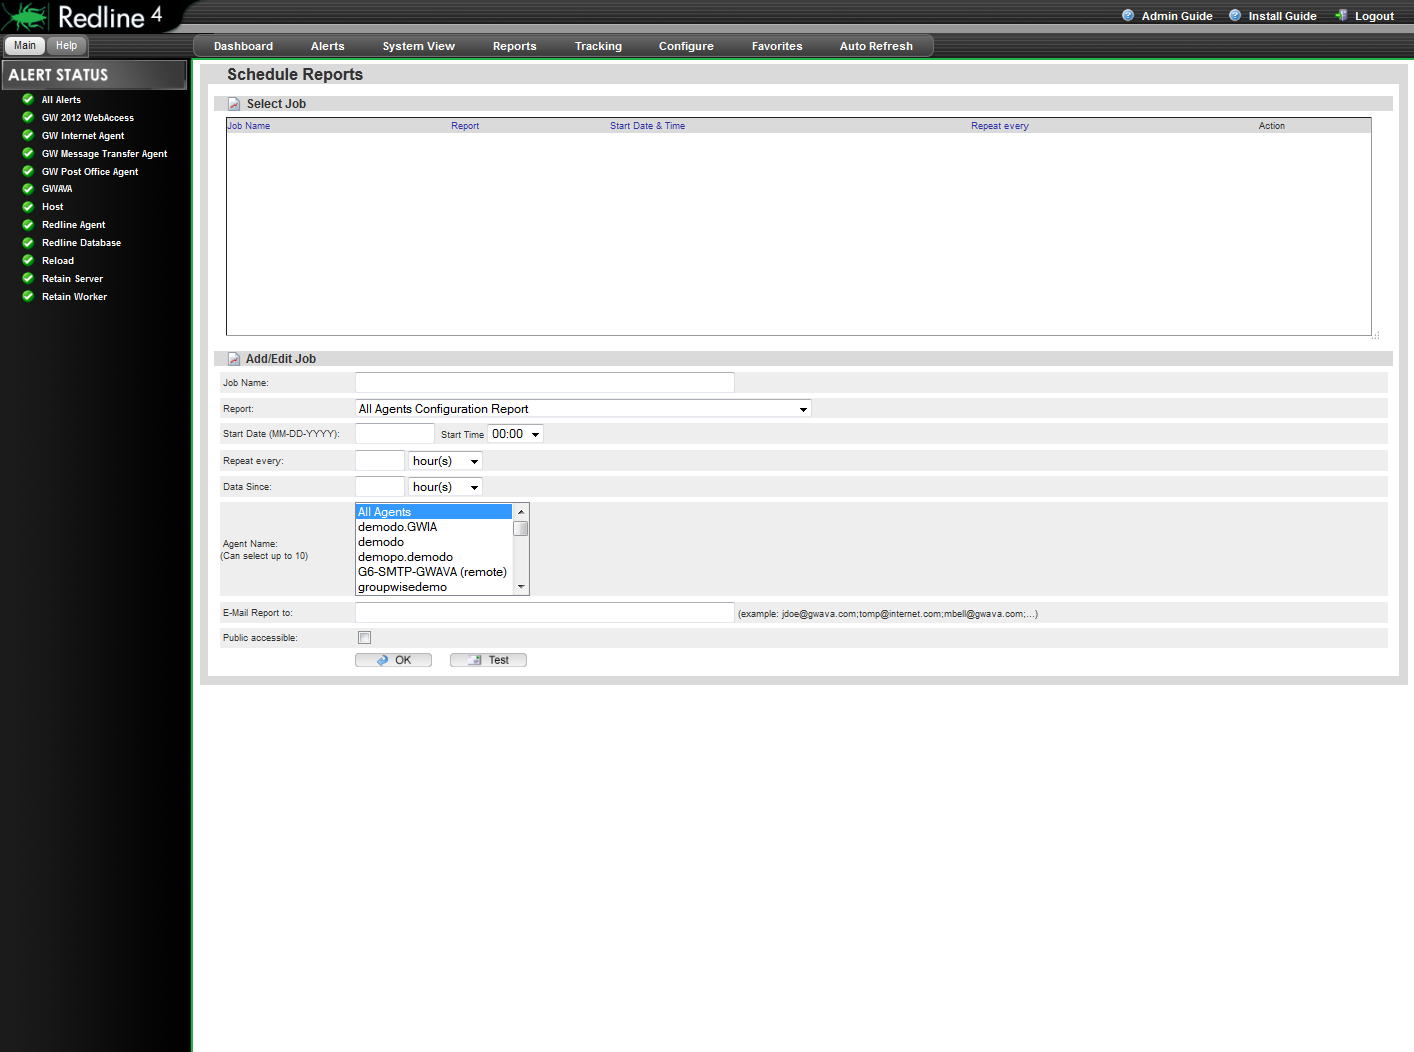
After the Scheduler is configured, a regular report job may be created and scheduled. It is possible to schedule a report based on hours, days, weeks and months. If a report supports specifying the agent name or a date range, it is possible to define what date range or specific agent the scheduled report should consider.
-
Job Name: A unique name for this scheduled report
-
Report: Select the report from one of the predefined list, compliance or business reports.
-
Start Date/Time: The time and date when the report runs the very first time
-
Repeat every: The interval when the report will be executed.
-
Data since: The timeframe which will be used by the database query.
-
Agent Name: The agent(s) the report is to be run against. This may be applied to all agents, or select up to ten agents to include in the report.
-
E-Mail Report to: Redline may send a report through email to a desired recipient upon completion.
-
Public Accessible: As there may be other users besides the administrator accounts created in Redline, this will make the report accessible to non-admin accounts.
When the scheduler runs, reports are generated automatically then saved to (redline Path)\db\reports directory. I.e.: opt\beginfinite\redline\db\reports.
4.5.5 Report Browser
The Report Browser lists the current list of scheduled reports which have run. You may also view the various reports that have been generated by clicking on them. Scheduled reports do not need to be emailed to a recipient to be viewed; they may be viewed through the report browser at any time as long as they have been run. If a scheduled report not been run, it will not appear in this list. On initial install, the list will appear very empty. Once reports have been scheduled and run, the saved report data will appear in this dialog window for access and viewing.
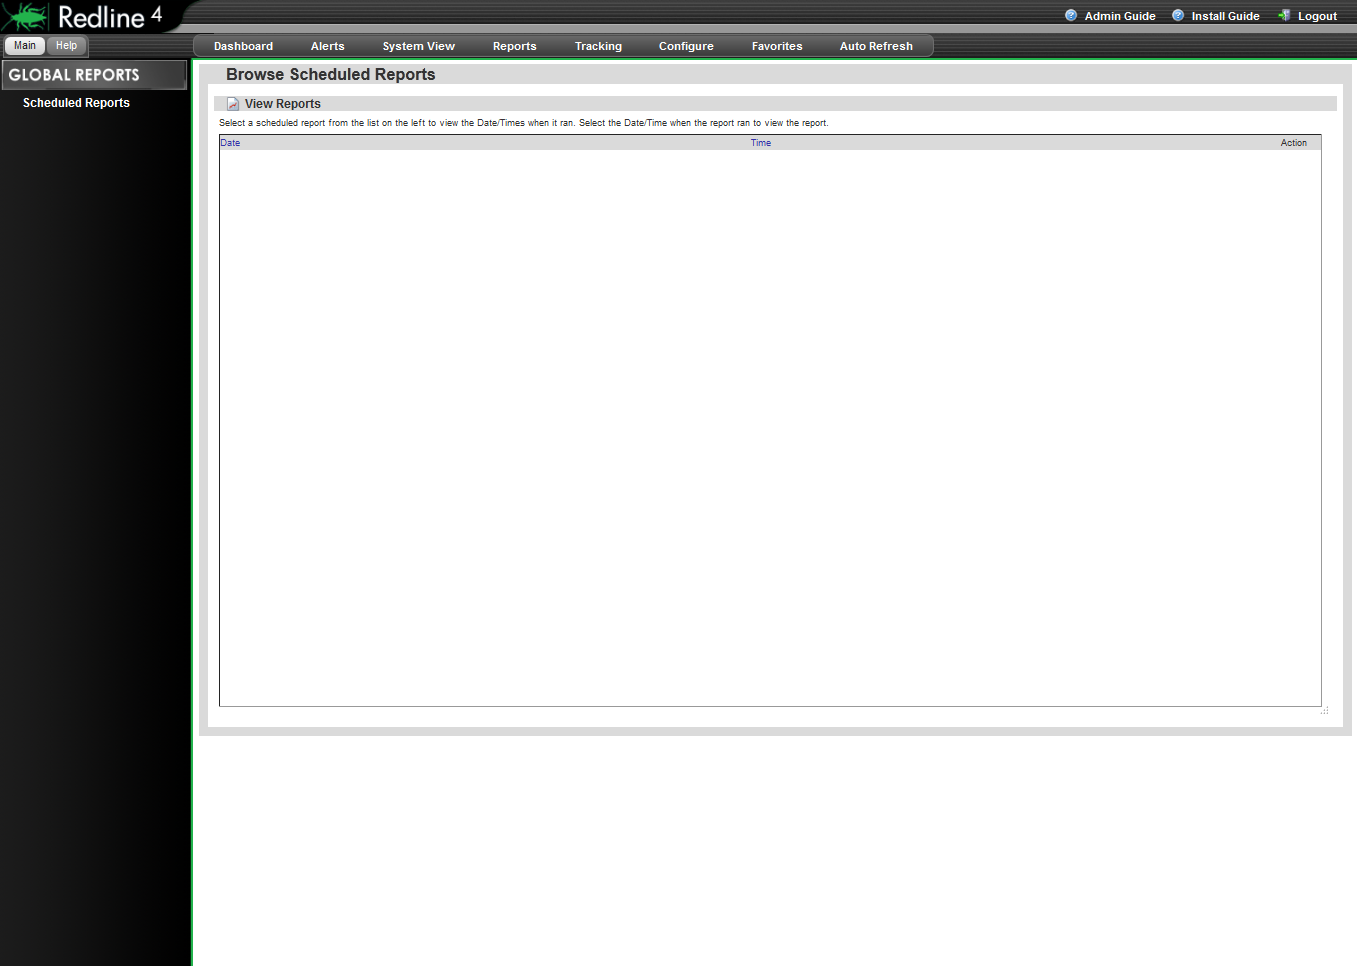
To view a scheduled report, select the desired report from the list under the ‘Global Reports’ section to the far left. Clicking on the action icon next to the desired report date opens the specified report for viewing. Reports purged from the system by the report expiry date in the Configure Schedule report tab will no longer be available or listed.
4.5.6 Query
It is possible to query all database tables directly, or run predefined queries. Queries are mainly used to view data from the Redline database, but may be utilized to create a list report.
Running the predefined reports is very easy, but you need to understand how the query reports work to build your own reports.
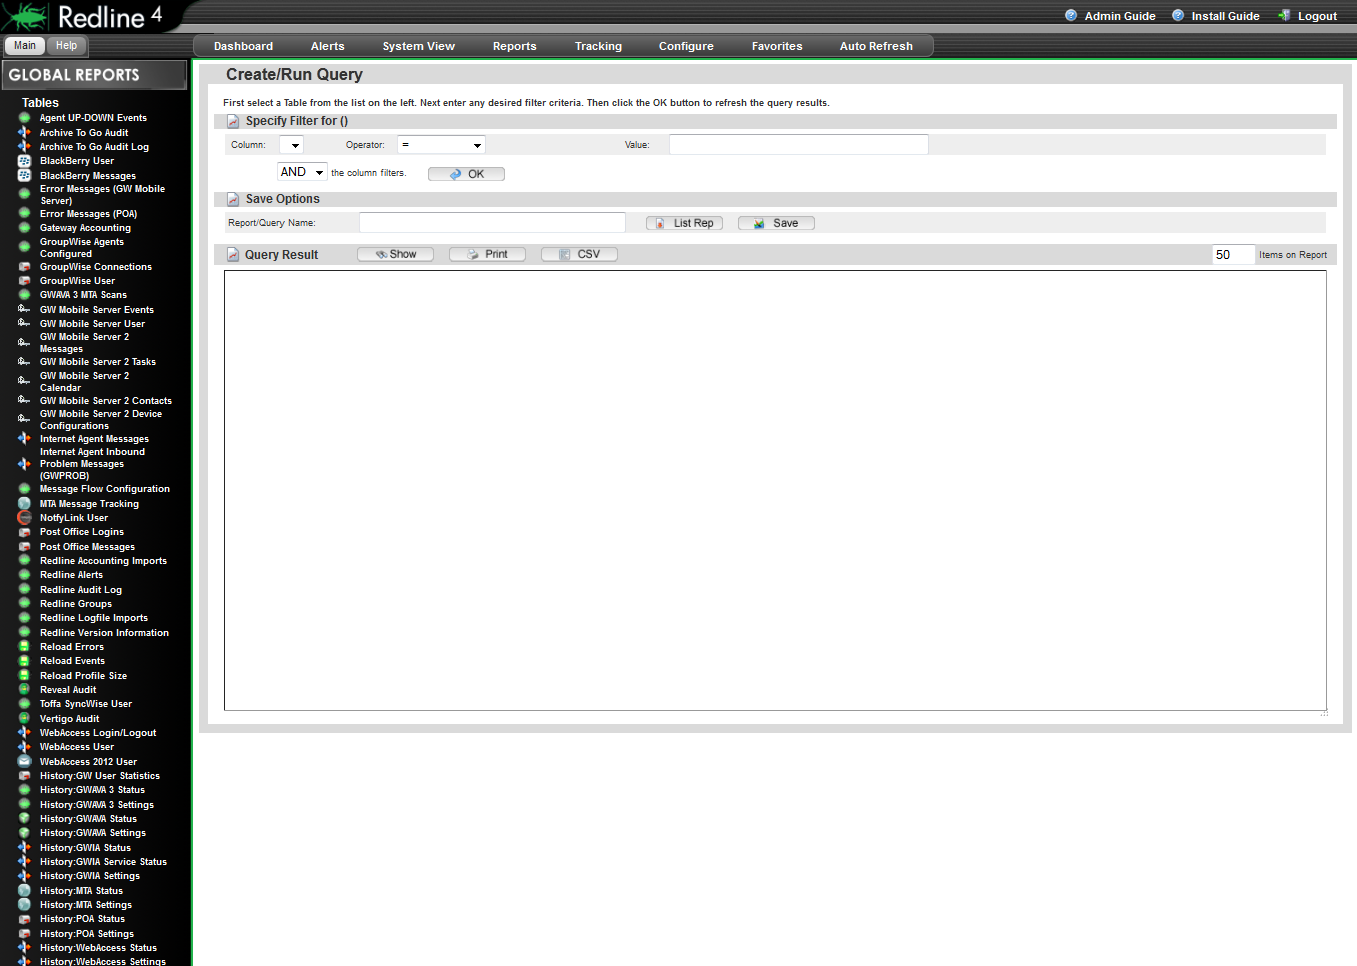
Query Redline databases
Redline stores its data in multiple databases. With the query interface, you can access all database tables without any restriction.
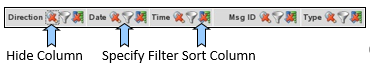
After you've selected a table, the table is loaded and data appears. You can hide columns, sort the data and specify filter on any column desired. Every column has three icons to do this:
-
Hide Column: If you hide a column, the icons for the column are still visible on the screen, but the title and the data is not shown any more. If you print or export the report, these columns are not on the report.
-
Sort Column: You can sort based on every column you want. If you click the sort button the second time, the sort direction is reversed. A third click disables sorting on this column. If you enable sorting on multiple columns, the order is based on what column was selected first. That way you can sort a table on as many columns as you want.
-
Filter: You can specify a filter on every column, not on just one column. As soon as a filter is specified, the filter icon has a small tool on it.
Redline can utilize AND and OR operations to apply filters and search criteria to simplify the search records.
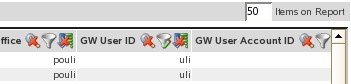
If you need more or less items on the screen, you can specify the number of rows.
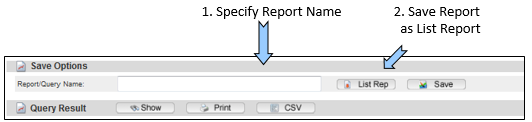
When you are happy with the result, you can print the report or export it as a CSV file which can be imported into OpenOffice or Microsoft Excel. If you need this report on a regular basis, you can save it as a List Report. Specify a Name for this Report and click the “List Report” button.
If you have specified some filters etc. for a query report, browse to another place in Redline and come back, all filters, sorting, etc. are still present. All defined filters, sorting and hidden columns will be reset every time a new table is selected.
Edit Queries
Once queries have been created and saved, then queries will display here in the same manner as a report is displayed. On install, this section will appear blank.
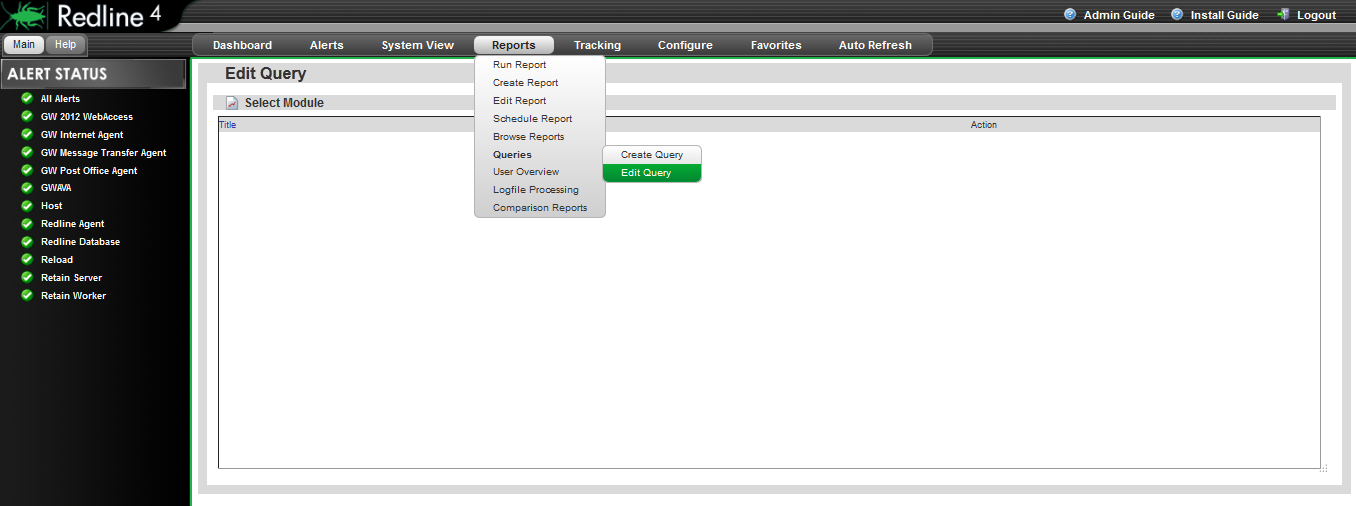
To edit a query, click on the query title. Once loaded, modify the settings as desired.
Table Indexes
Database table indexes are very important to speed up queries and thus executing the reports is much faster. If you define a filter in a query report and the response after defining the filter is slow, you might need to define a table index on this column.
The SQL Database Configuration page is found under the Configure | Control Center | Database drop down menu.
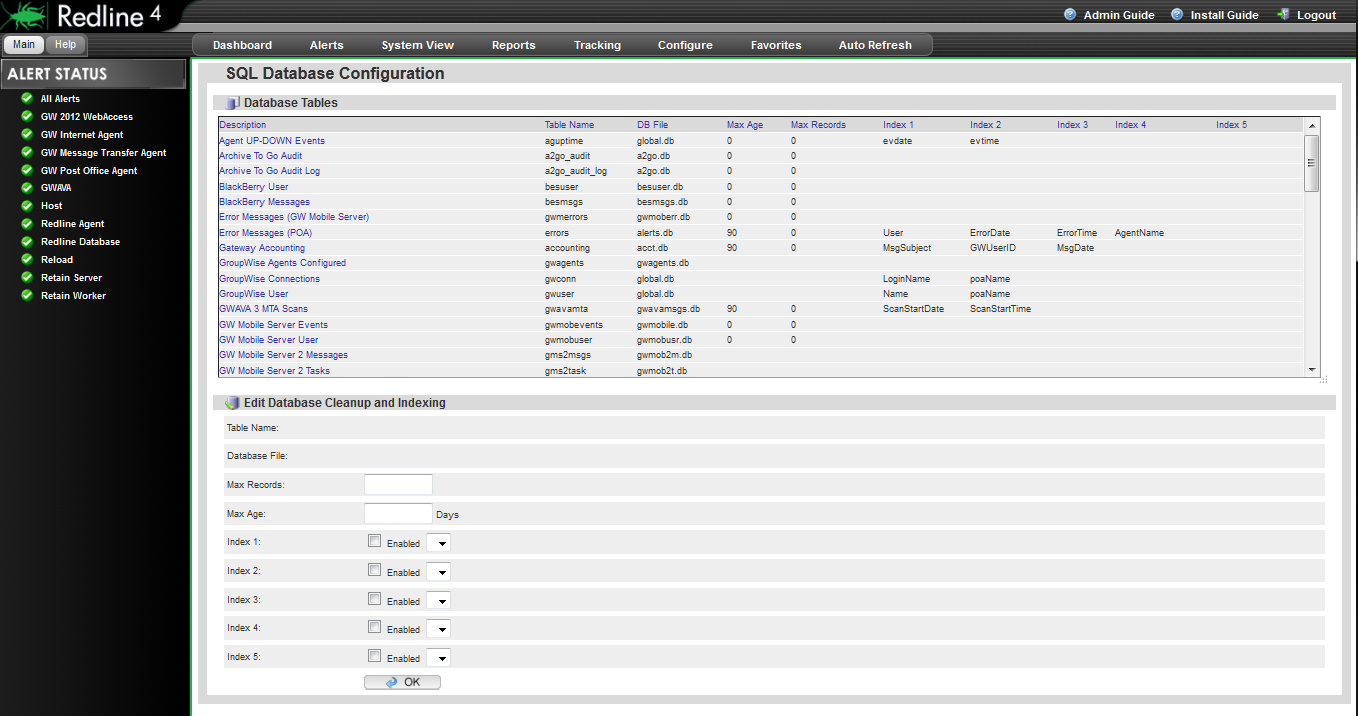
You can define up to 5 indexes for every table in Redline. Make sure you define indexes for columns where it makes sense only. Indexes which are not needed will slow down report generation.
How to define a table index
-
Assume you need an index on the column “E-Mail” of the table “Blackberry User”
-
Look for the table “Blackberry User” and click on it
-
Mark the checkbox for “Index 1” and select the column “E-Mail”
-
Click OK
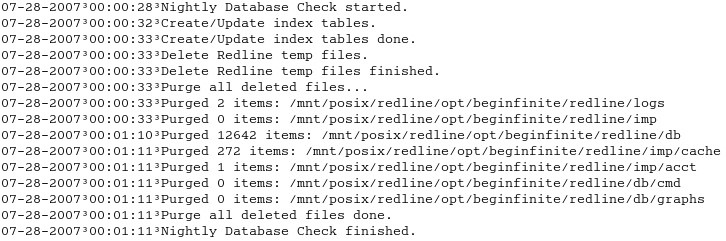
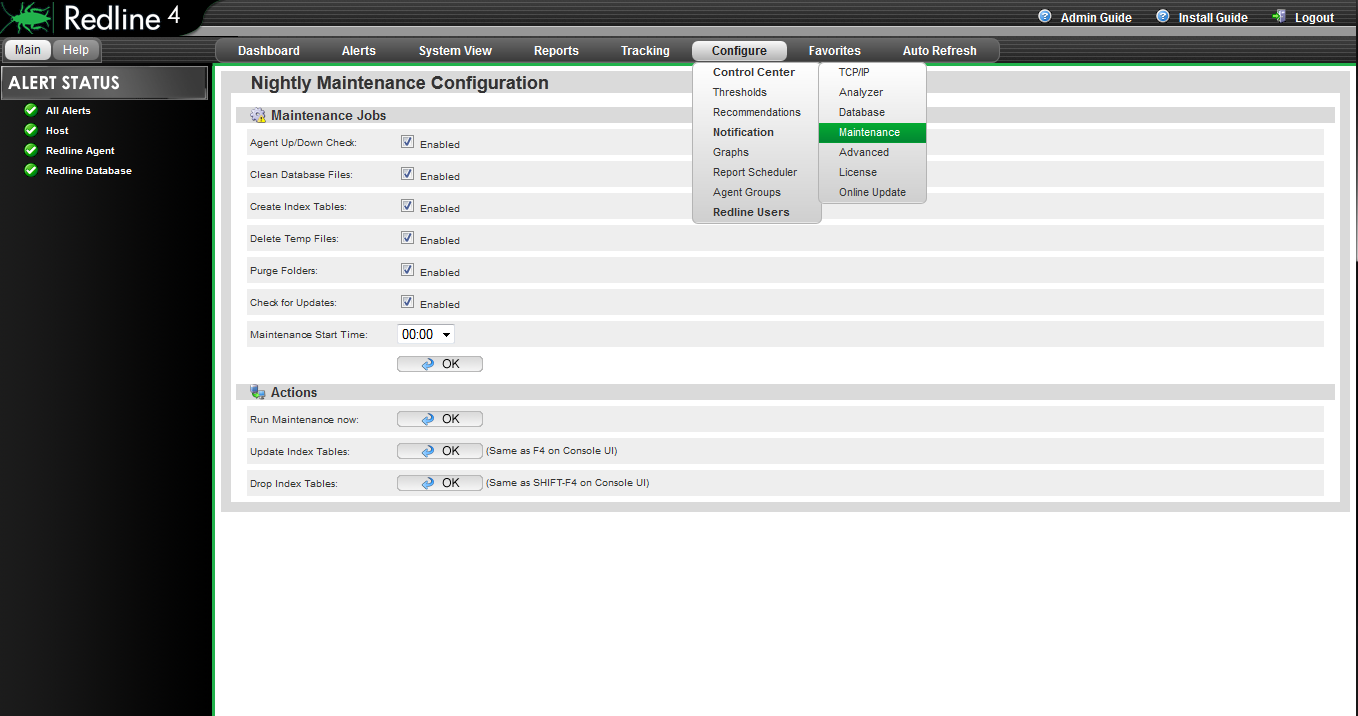
Indexes are not generated immediately after they are defined. Every midnight Redline is doing a database check which includes the creation of missing table indexes. Indexes which are not defined any more will be removed during the nightly database check as well. If you consider the rlcc.log file you can see when and how long the check runs. During that time, it is not possible to login to the Web UI of Redline.
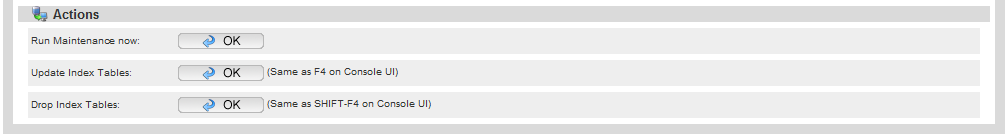
You can force this process if you browse to the “Maintenance” section under Configure | Control Center | Maintenance. Locate the ‘Action’ area and click the ‘OK’ button next to the “Update Table Indexes” option.
Be aware that this can take some time if a new index needs to be created on a large table.
4.5.7 User Overview
The User Overview displays essential information on any selected user. Detailed use and account statistics can be quickly and easily obtained for any user in the system. However, for the User overview to display any users the GWCheck files must first be obtained. See the Redline Install Guide section ‘Creating the GWCHECK Events’.
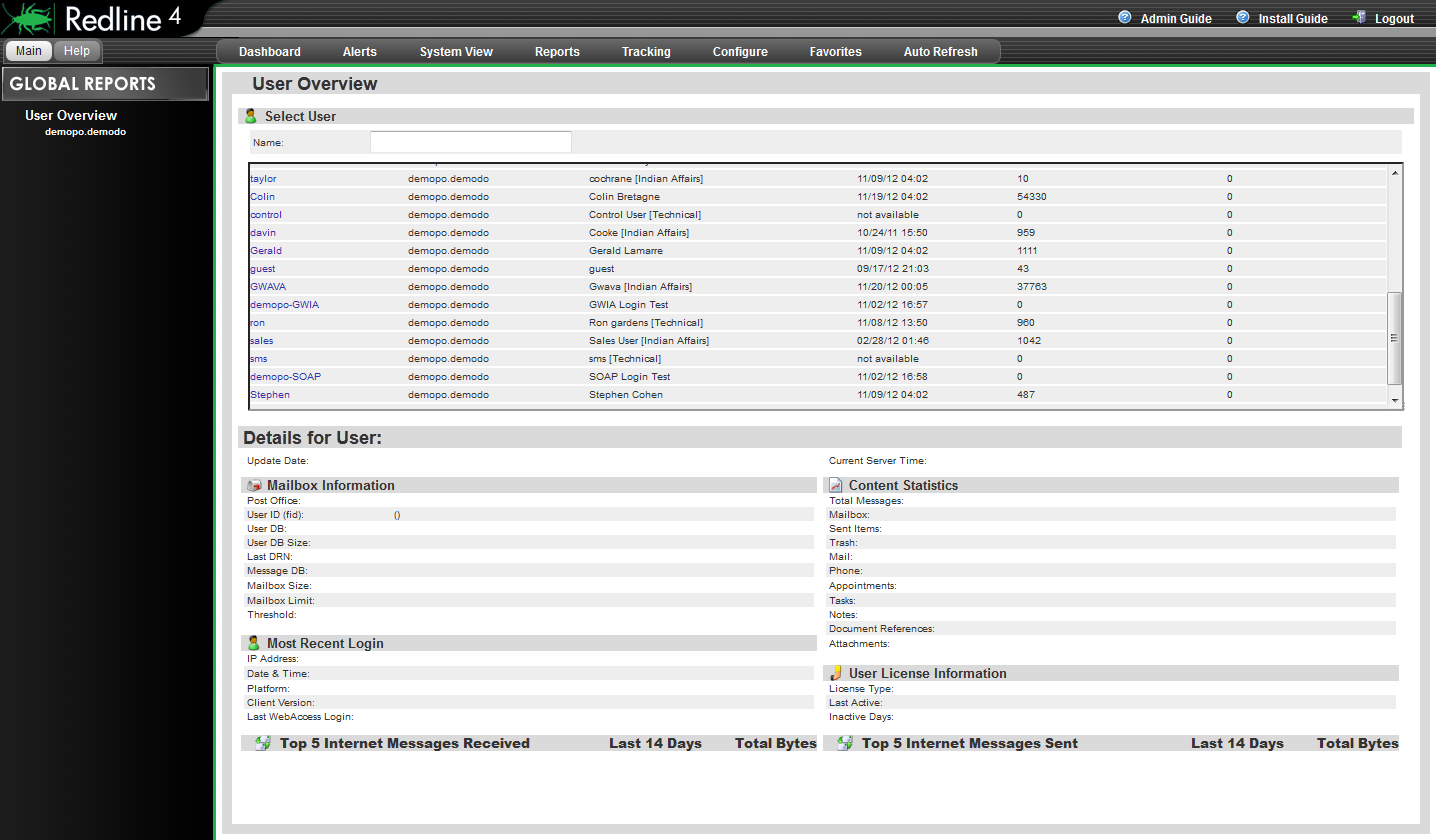
To search for a user, place a user name in the user name box and hit ‘enter’. All users matching the search criteria will be displayed. To display all users on a specific post office, select the post office from the ‘User Overview’ menu on the left.
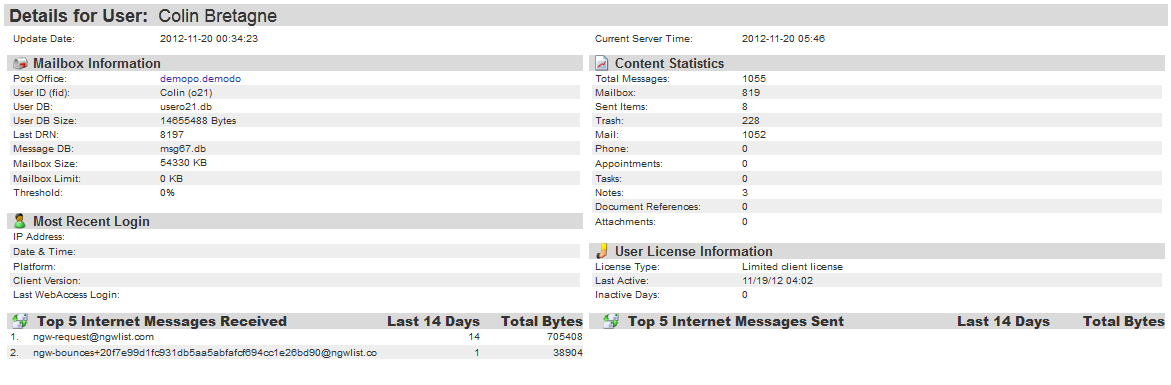
Select the appropriate user from the search results by selecting the username. Once selected the desired user's information will propagate in the User Overview window.
4.5.8 Logfile Processing
The Logfile Processing page displays the relevant path and status information of how Redline is processing log files for the different monitored agents connected to the system. (These numbers reset when the Redline Control Center is started.
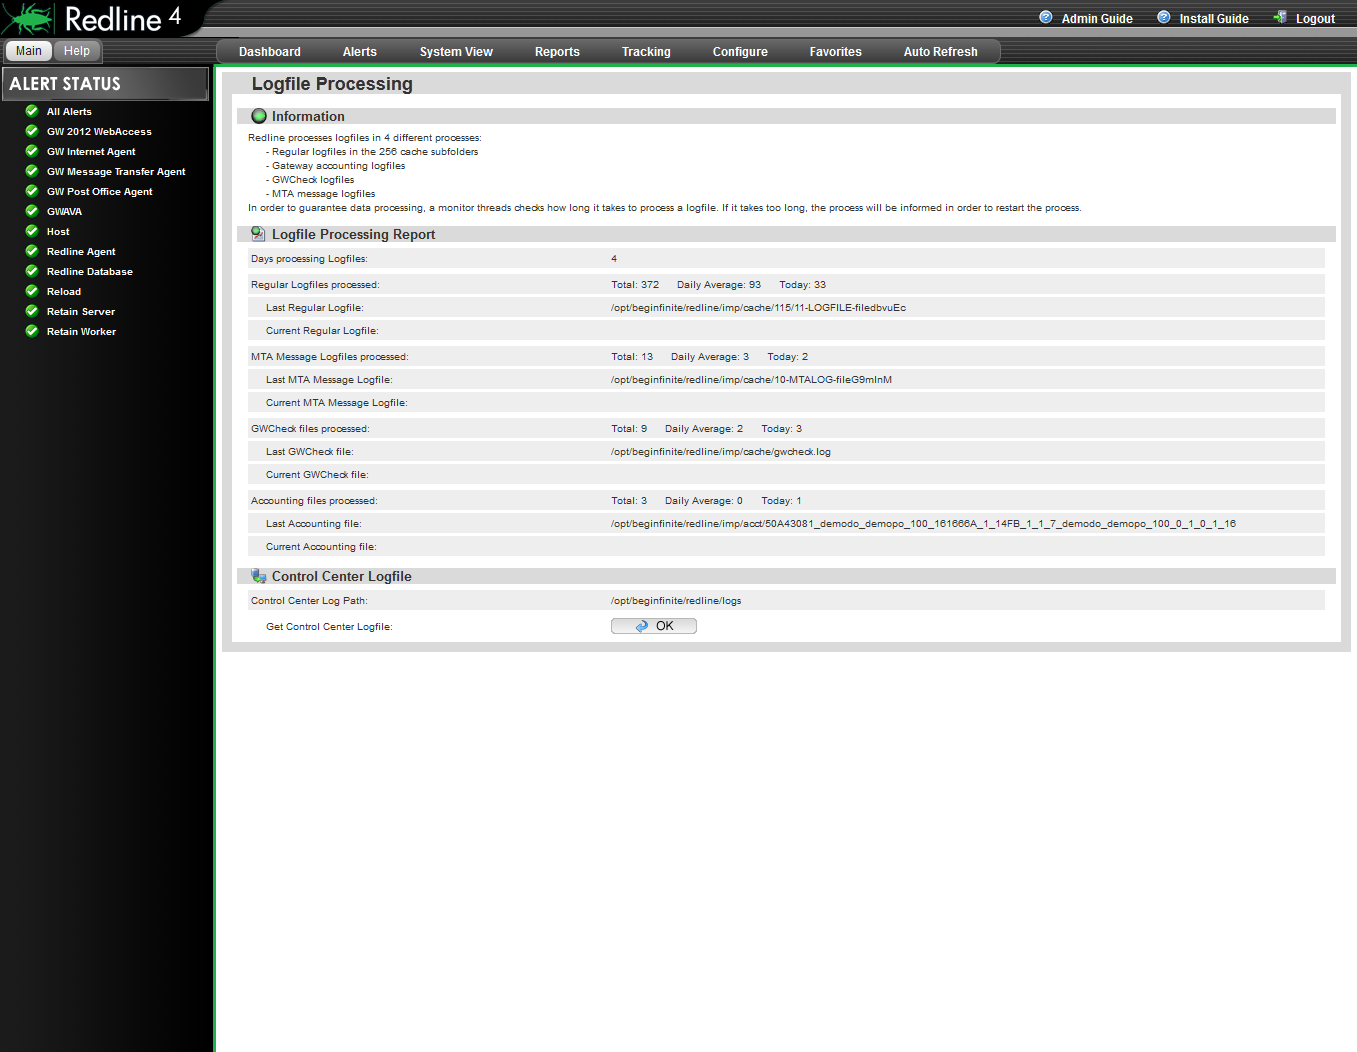
The only item on this page which is not informational is the Control Center Logfile, which can be downloaded by clicking the OK button.