4.8 Application
How to configure Agents and specific settings
How to configure a new threshold or recommendation
-
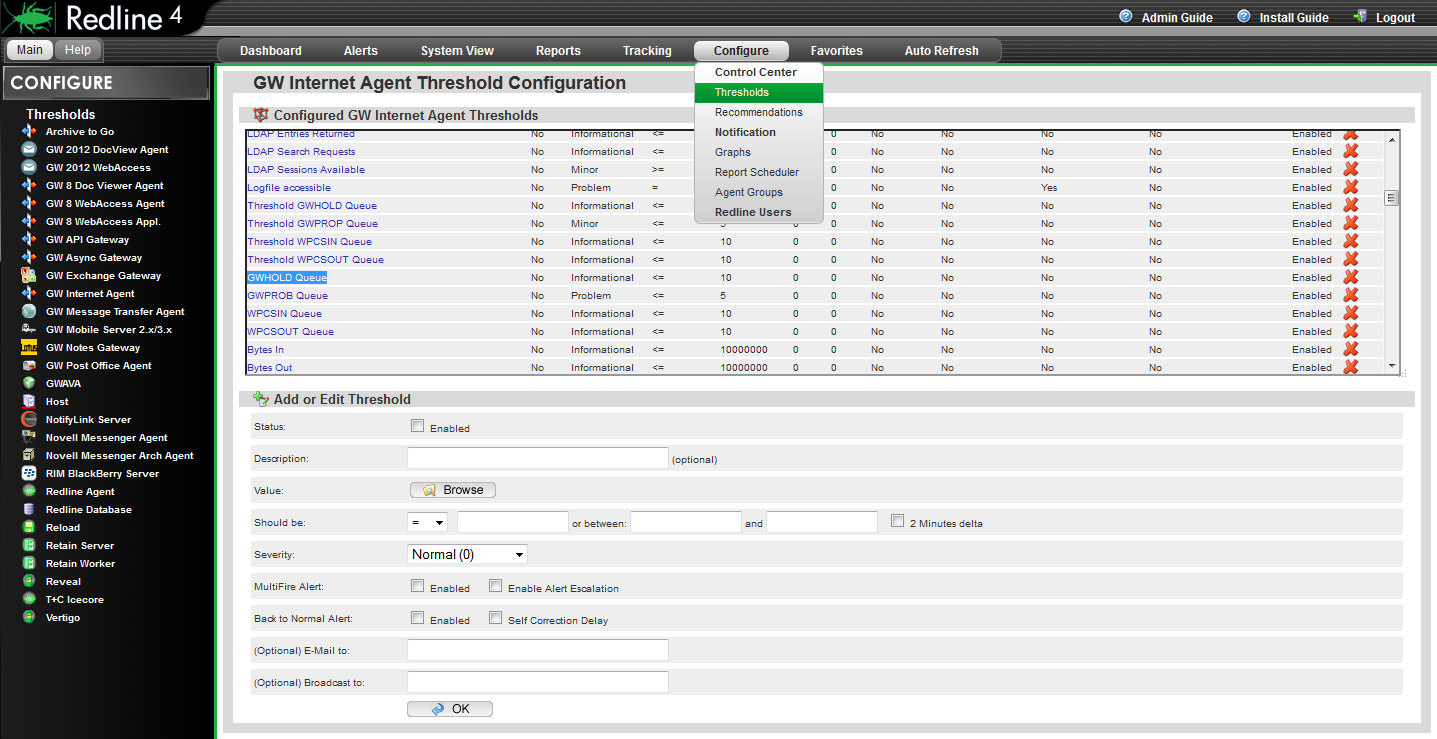
We want to make sure that for all Internet Agents, the number of items in the GWHOLD queue doesn't exceed more than 30 items.
-
Click on the “Configure” drop down menu and select ‘Thresholds’.
-
From the left-hand menu, select the GroupWise Internet Agent.
-
Select the value “GWHOLD Queue”.
-
Click the status enabled checkbox
-
Specify the threshold “Should be” “<=” “30”.
-
Set the severity to Minor
-
We want the alert to solve itself as soon as the hold queue has less or equal 30 items. Check “Back to Normal Alert”.
-
Click OK to save the new threshold.
Recommendations are defined in the exact same way as thresholds, and located on the Recommendations page, below the threshold configuration area.
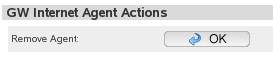
4.8.1 Removing Agents
Sometimes it is necessary to remove an agent from Redline. At the bottom of the manage page for each agent is a button which will remove that agent from the list of active monitored components.
The agent will no longer show up on Dashboard, Alerts List or System View, however, all data about this agent will stay in the database for reporting. It is important to keep this data for tools like Message Tracking, message analysis reports, etc.
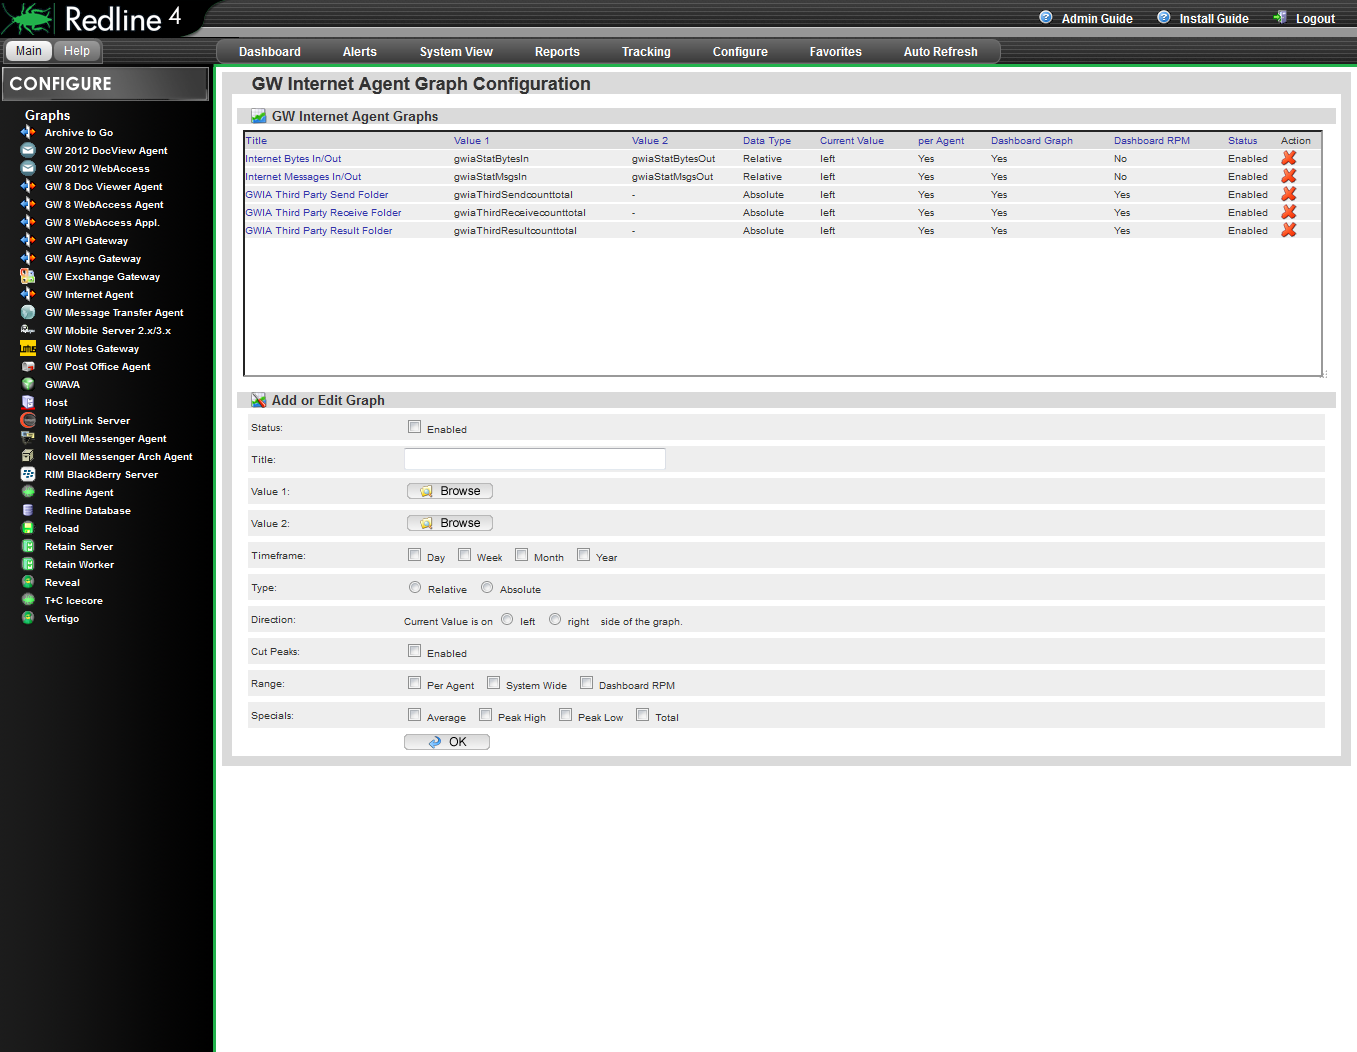
4.8.2 Configure graphs
The Configure | Graph page contains configuration for graphs on the different agents in the system. Individual graphing has several different options for each agent, and each graph type has its corresponding configuration listed with each specific agent. To select a new agent, locate it in the left-hand menu window.
Every value that Redline monitors can be used to generate graphs. Configuring graphs can be done in two places: Configuration, for global settings, and in the System View for separate, individual agents. If you define a graph in the Configuration area and not in the System View on the agent, you can generate graphs for every agent by configuring one graph setting. The disadvantage is that all the graphs are stored on the disk drive. If the system has many agents, global graph creation can create a lot of files.
Elements that can be customized in graphs include:
-
Status: Enabled/Disabled
-
Title: A human readable name for the graph
-
Value 1: Any value that Redline can monitor
-
Value 2: Any value that Redline can monitor
-
Timescale; Day, Week, Month, Year
-
Type: Relative or Absolute
-
Direction: Current value is on the left or right side.
-
Range: Per Agent, System Wide, Dashboard RPM.
-
Specials: Average, Peak High, Peak Low, Total.
Status
Instead of removing a graph configuration it is possible to disable a graph. That way you can enable the graph later.
Title
The title is a human readable description which will show up as the title in the charts. This can be any text you want.
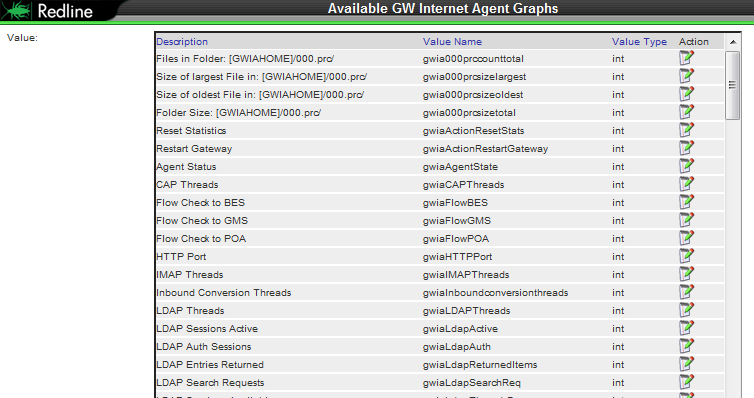
Value 1/Value 2
You can browse for all available values. The window lists all values including description, value name defined by GroupWise and value type. The available values are defined with the Redline schema files.
Timeframe
Graphs can be generated for different timeframes. For every timeframe, a separate image will be generated. Available timeframes are:
-
Last day
-
Last week
-
Last month (Last 4 weeks)
-
Last year
Type (Relative and Absolute)
Relative values are used for counters that rise while absolute values are used for values which show a current state (for example users connected). Relative values can be used to draw charts with counting values, like the total number of messages processed. Relative values draw the difference between the values. Think about Messages Received from the internet. Redline reads this value every 2 minutes, and it could look like this: 120, 150, 180, 200, and 220. If you would draw the chart with absolute values, it would just go from the bottom left to the top right corner. A relative graph draws a line which shows that in 2 minute intervals 30, 30, 20, 20 messages have been received, which is more useful.
Direction
The current value in a graph can be discovered due to the time stamps along the bottom, and should indicate the displayed time.
Range
The range of collected data can be set for each graph.
-
Per agent – A separate graph is generated for every agent.
-
System Wide - Adds all values of the agent types into one graph, and this graph will be selectable on the Dashboard.
-
Dashboard RPM – If selected the summary of the value of all agents of the same type will be drawn in a RPM graph which can be selected on the dashboard.
Other selectable characteristics include Average, Peak High, Peak Low and Total.
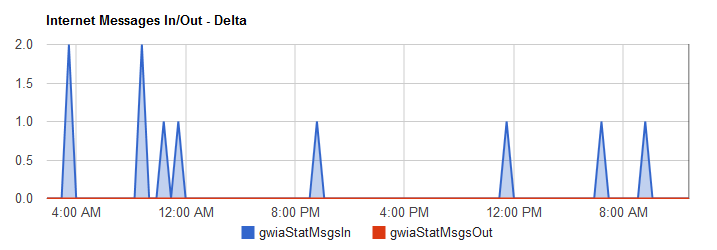
How to create a new graph with two values
Assume we need a Dashboard graph with the MTA values “Routed Messages“ and “Error Messages“.
-
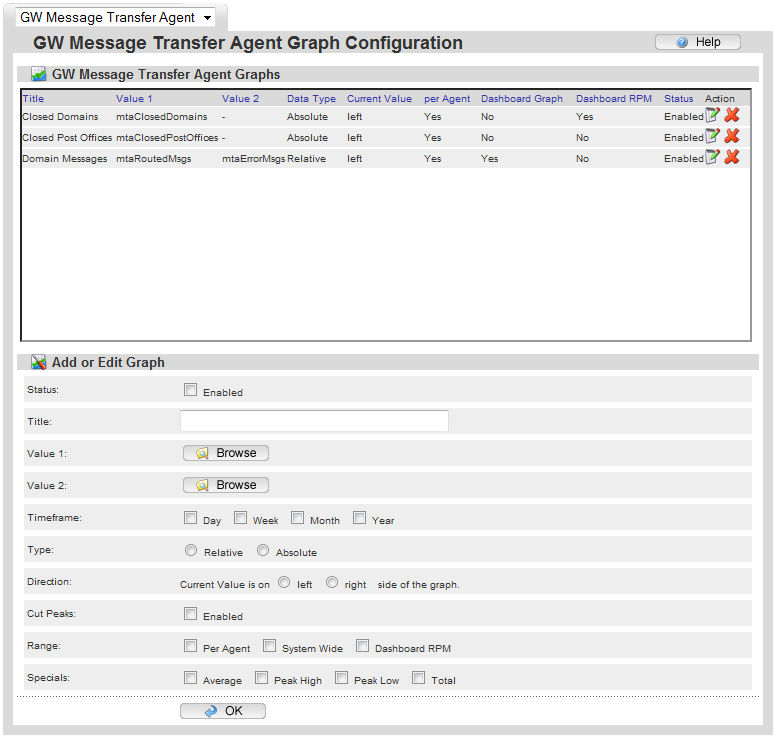
Click Configure / Graphs / GW MTA.
-
Check the Status Enabled checkbox.
-
Give the new graph a name, for example: Domain Messages.
-
Click on the “Browse” button for the first value and click on the column title “Description” to sort the table based on that column.
-
Click on the icon for “Routed Messages”.
-
Close the Window with all the available values.
-
Click on the “Browse” button for the second value and click on the column title “Description” to sort the table based on that column.
-
Click on the icon for “Error Messages”.
-
Check the checkbox for the timeframe “Day”, “Week”, and “Month”.
-
Select Type “relative“, because the values count messages.
-
Select Direction “Current value on the left side”.
-
Check the checkbox for “per Agent” in order to have a graph available in the System View.
-
Check all checkboxes for the 4 special values.
-
Click “OK” to save the settings.
-
Go to the System View and select a Domain.
-
Go to the “Graphs” tab and select the new graph.
It is possible to configure a graph for this agent only, if you define the graph on the agent’s configuration page.
4.8.3 Report Generation and Custom Reports
Modifying Reports
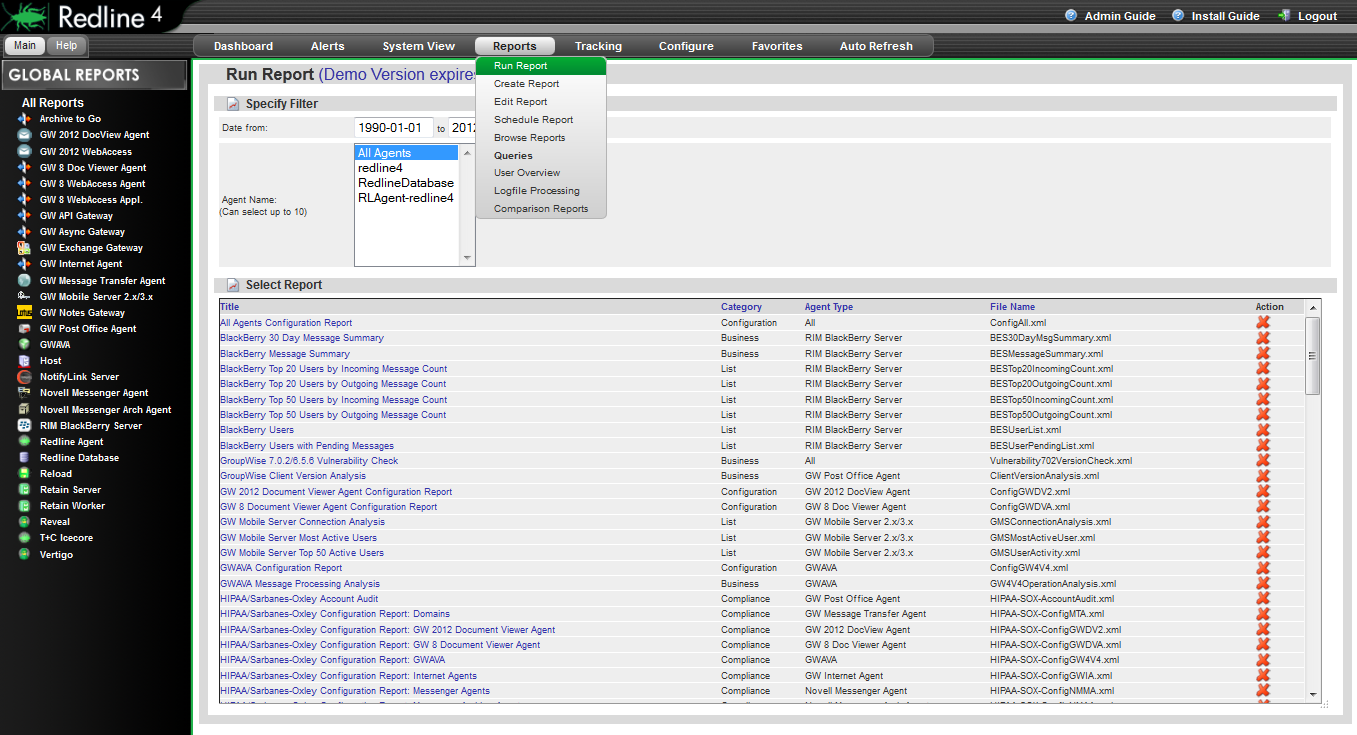
Browse to the Reports | Edit Report page from the dropdown menu.
To edit a report, you need to first select it. Find the desired report agent type from the left-hand menu and then browse through the reports listed for that agent and select the desired report by clicking on the name.
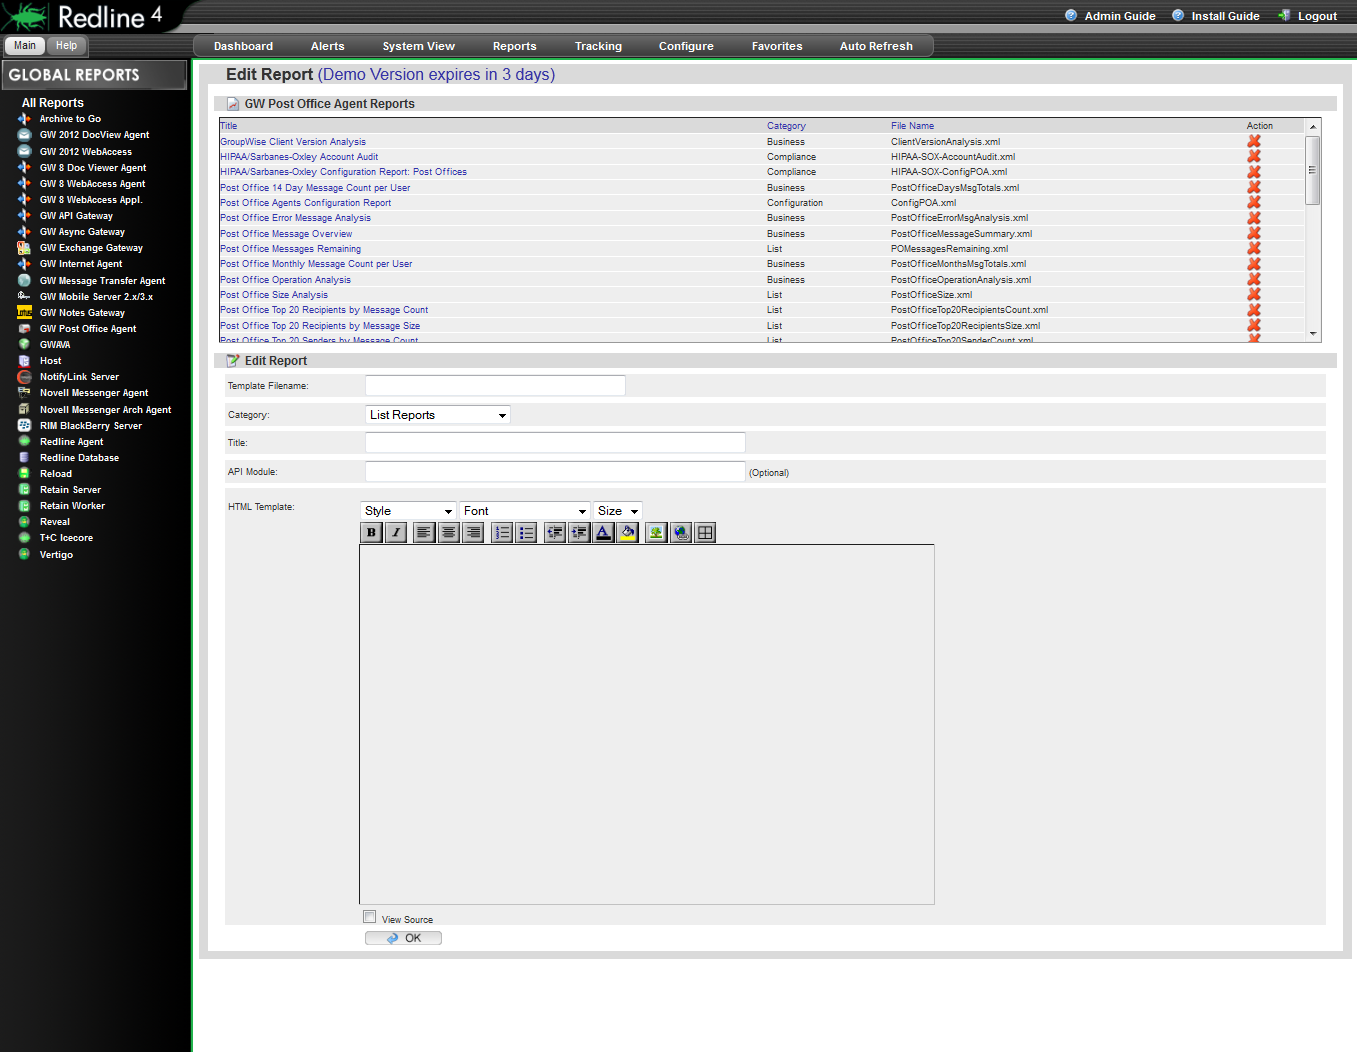
For our purposes, we will be creating a new report on the top 100 messages over 5 MB. From a very similar report: top 50 messages over 500Kb. This report is generated at the Post Office level.
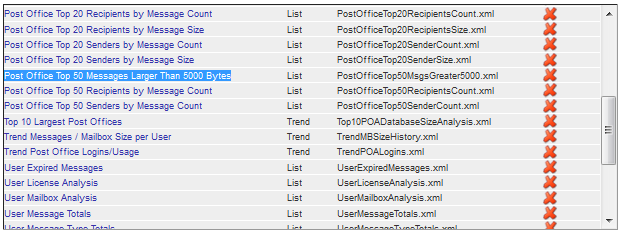
Locate the report you wish to use as the source for your custom report, and select the report by clicking on the name to open the report for editing.
The Report will be opened below for editing.
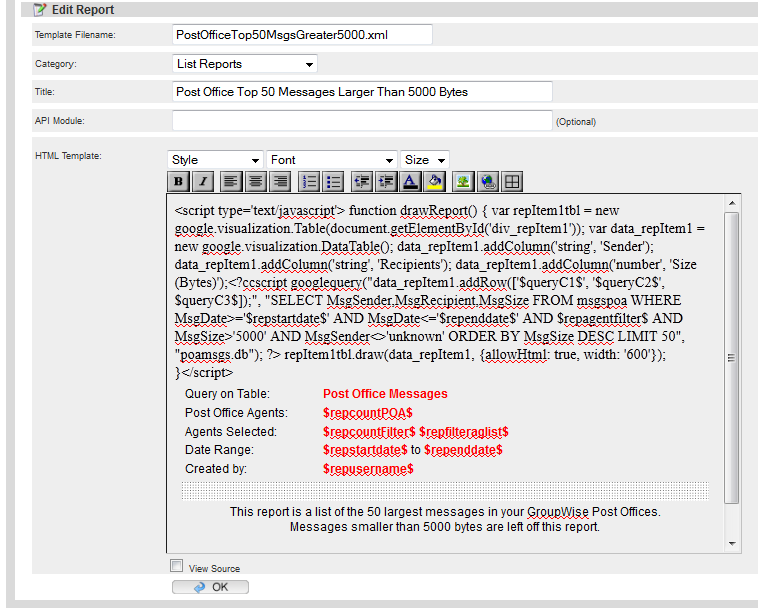
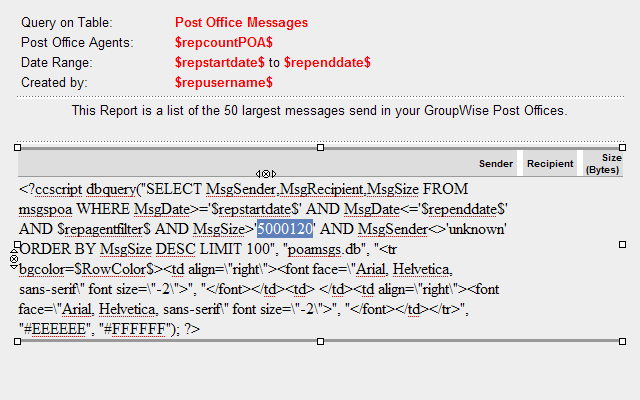
The Report is comprised of more than is listed here, but the database query is all that needs to be edited as it is the part of the report that grabs the data.
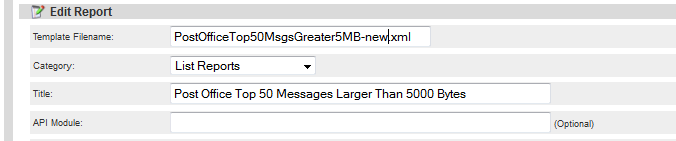
BEFORE YOU EDIT OR SAVE CHANGES IN THIS REPORT, YOU MUST CHANGE TEMPLATE FILE NAME, OR YOU WILL OVERWRITE OR CORRUPT THE EXISTING REPORT.
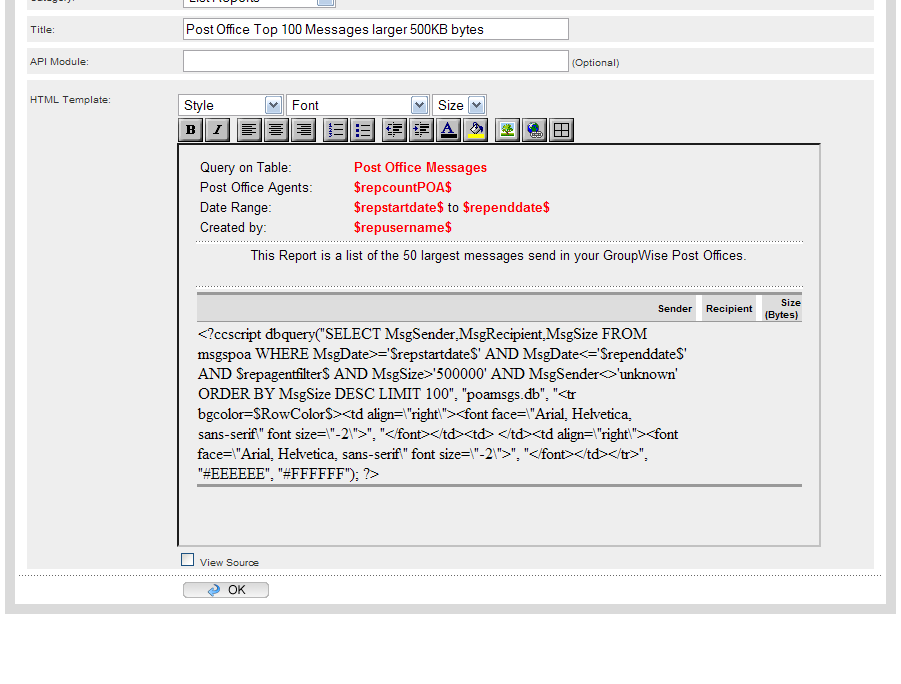
It is also a good practice to change the report title to match your new template name to simplify finding the report, and to have a correct title to your generated report. This is not required, and may be anything you wish.
Locate the SQL query in the report field. This usually starts with “ccscript dbquery”. Edit the SQL query to provide the desired effect.
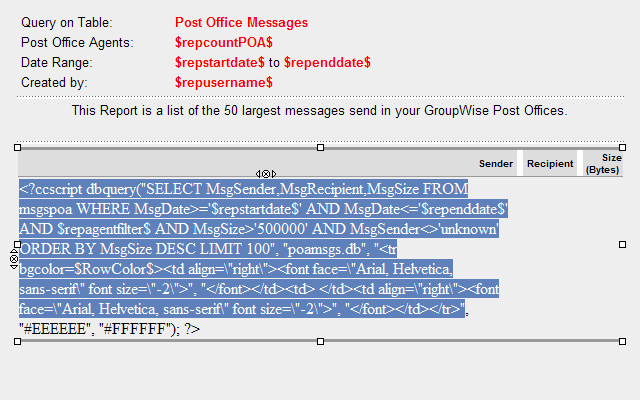
For this report change, we only want to change the message size parameter.
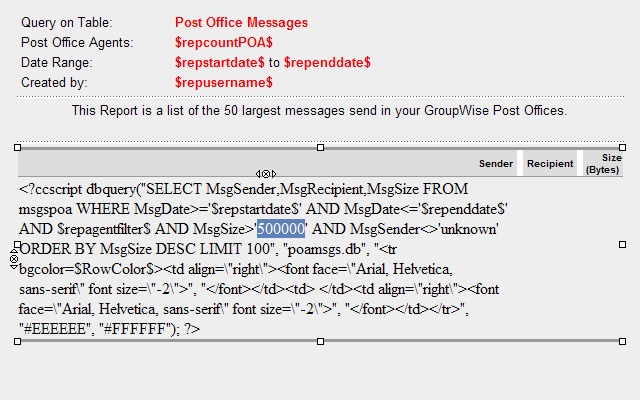
The size limit is listed in bytes, (500000 = 500KB). We wish to generate a report that shows messages over 5MB. Edit accordingly.
To save the change and list the report, click the OK button at the bottom of the screen.
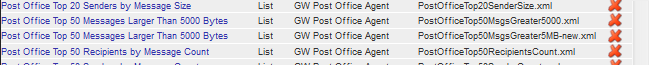
Your new report is saved and will be listed with the rest of the reports.
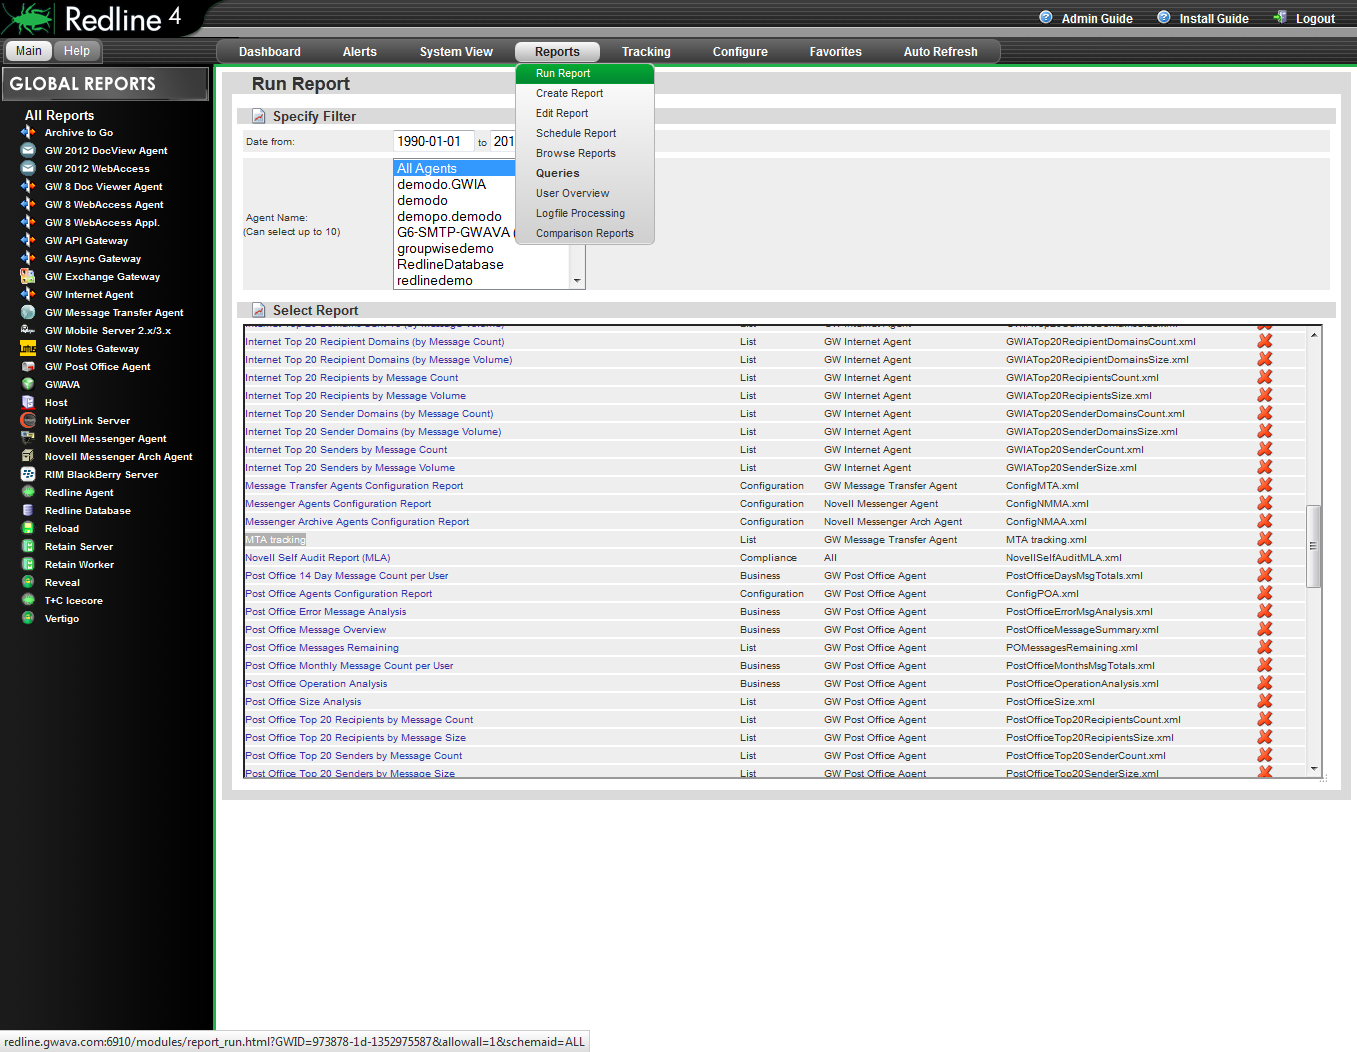
To Run your new report, go to Reports | Run Report.
Locate your new report from the report list. The list is alphabetical, per the report title. If you didn’t change or specify a new title name but did change the template filename, then there will be two listed.
Select and run the report by clicking on the report name to complete operation. Make sure you select the report that was modified instead of the original.
Query Creation
Select the Create Query page from the Reports | Query menu.
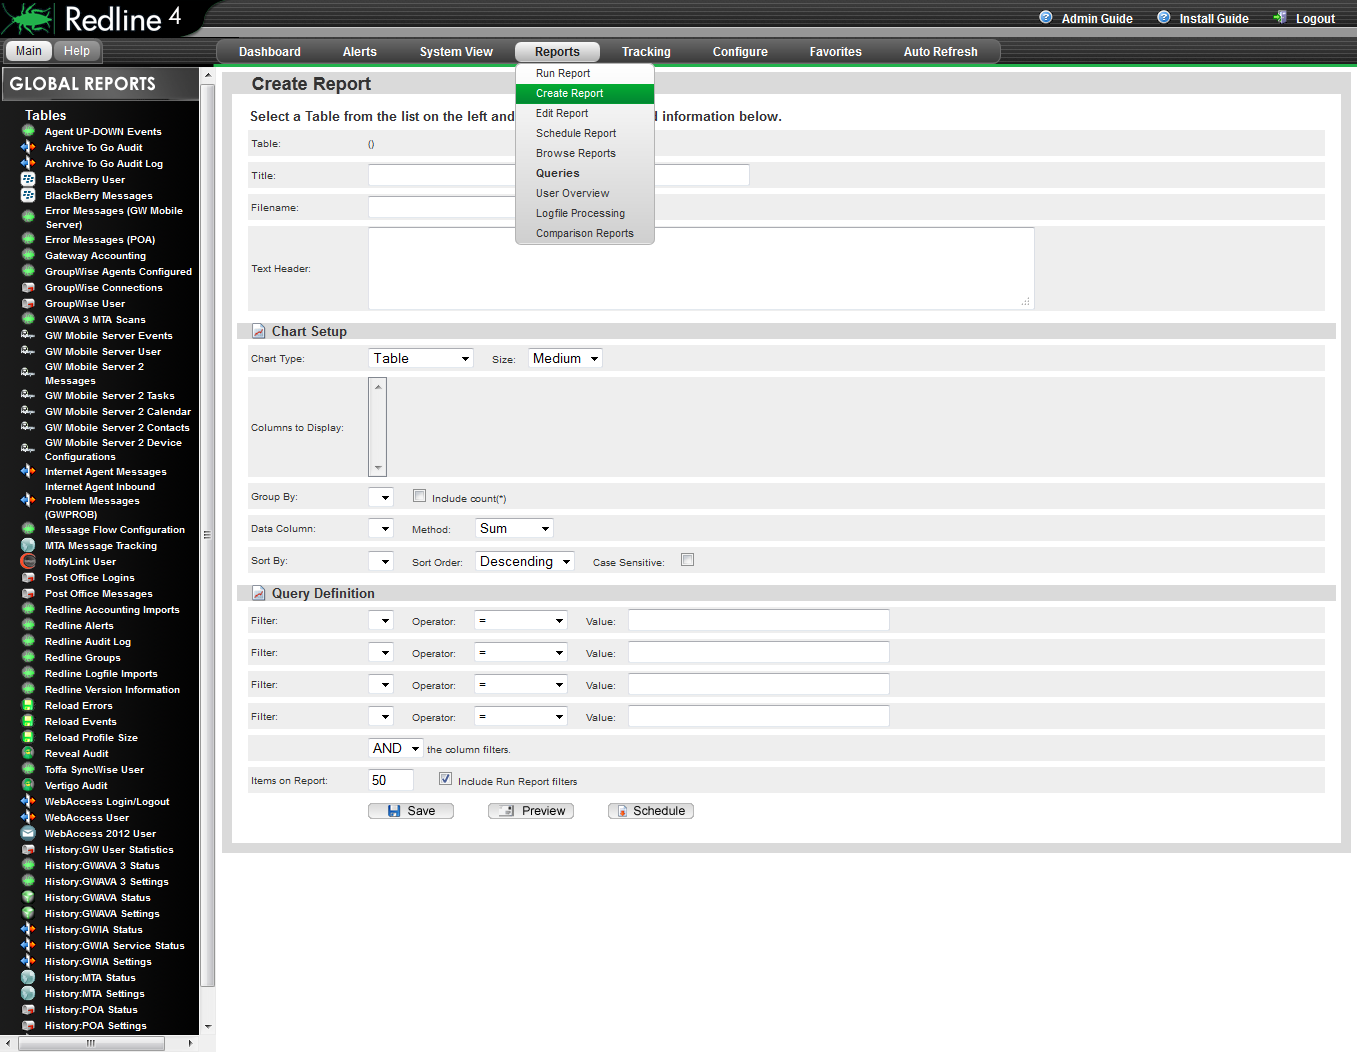
Select the table you wish to run a query on from the Tables menu on the left. This loads the different tables for any selected object. The results will be displayed in the Query Result window.
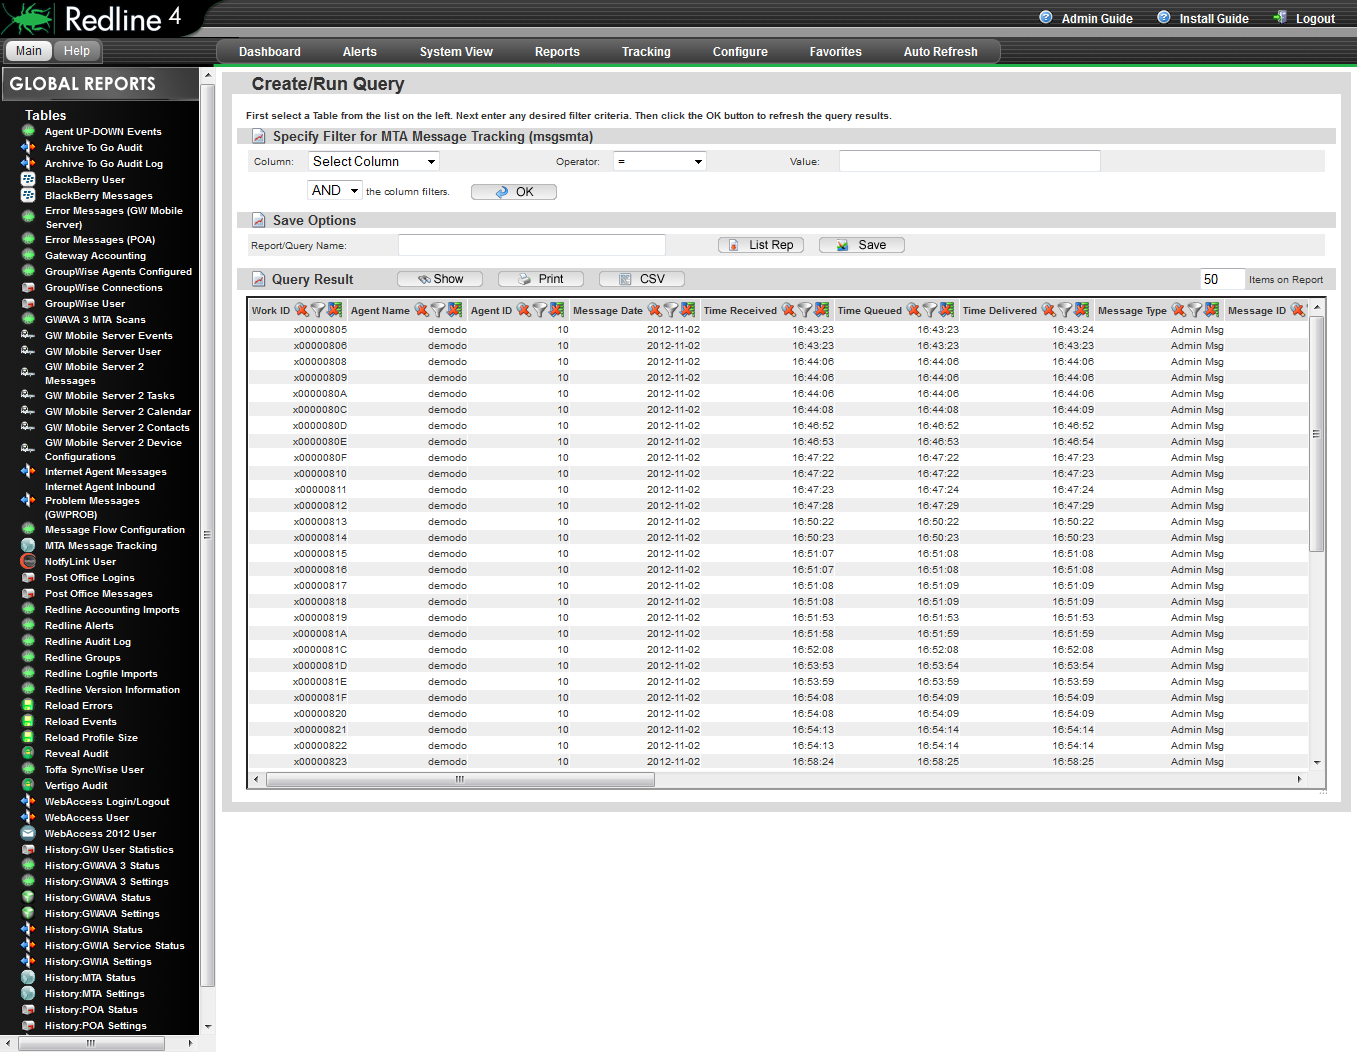
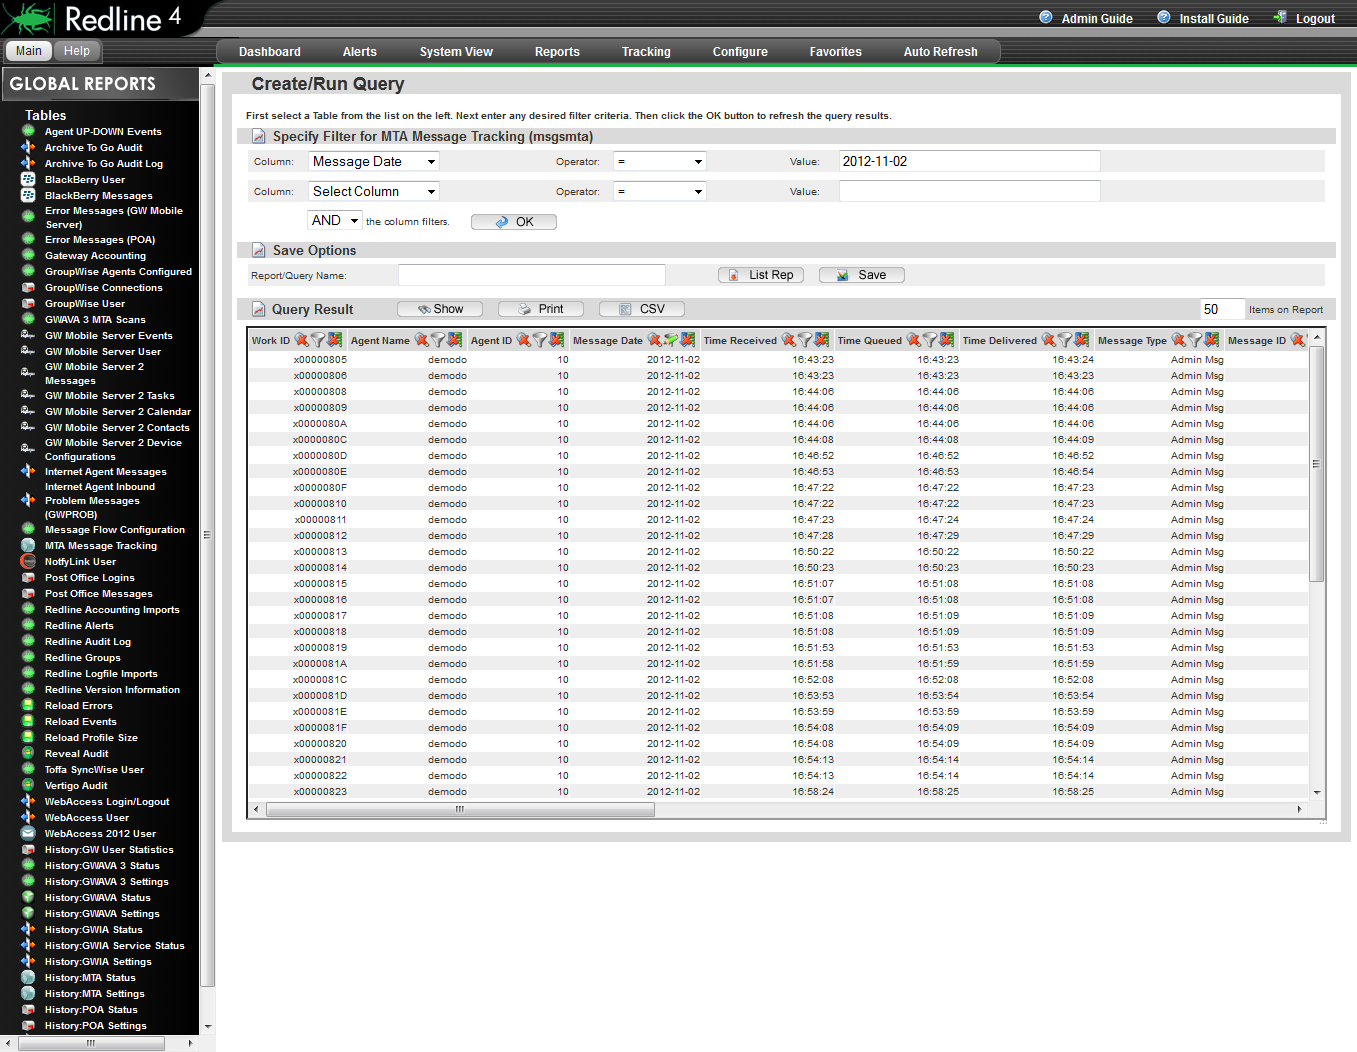
The Specify Filter option near the top will filter the results to what is desired. Use the same format for the filters as is displayed in the results window. For example, a date should be entered as 2012-11-02, as is displayed in the results window. Multiple filters may be used in conjunction with either the ‘AND’ or ‘OR’ operators.
NOTE:The filter parameter is CASE SENSITIVE and DOES NOT allow wildcards. To effectively specify a working filter, you need to be able to see the query results, so you can specify a filter exactly as the result is seen by Redline. A typo will cause the filter to exclude all results.

The filter becomes active when you select the OK button and the query results are loaded.
There may be several filters active at the same time. As a new filter is added, an additional empty row will be automatically added to the interface.
To remove these filters, open the ‘Column’ drop down menu and return it to the ‘Select Column’ option. Repeat for as many filters you wish to remove, in the order you wish to remove them.
To save your query results as a module, specify a Report or a Module name, and select the List Rep button. (If you select the ‘Save’ button, your query will be saved. The List Rep button simply saves the query as a full report which can be run later.)

Queries saved as list reports can be accessed, run, or modified just as the other reports.
To run your custom report, select the report name from the list. The report will be generated and displayed.