7.8 Viewing Memory Configurations

Viewing the general information can help you understand how your server is using physical memory and which programs are using it. It can also help you to understand how the logical address spaces for the NetWare kernel are being consumed. Knowing how memory is used can help you determine whether to add more memory to your server to increase server performance, to unload specific NLM programs that might be causing memory problems, or to change other settings that might allow the server to use memory more proficiently.

Figure 7-11 Example View Memory Config Page

To view general memory information, access the View Memory Config page by clicking the View Memory Config link in the navigation frame under the Manage Server heading.

The following table describes each statistic or action of a link shown on the View Memory Config page.

Table 7-9 Description of Statistics, Links and Actions to Perform from the View Memory Config Page

Statistics or Link

Description or Action

NLM Memory

Shows the total physical memory allocated by the operating system to the NLM programs that are loaded on the server.

Links to the List Modules page that shows the details of how each NLM program is using memory.

File System Cache

Shows the amount of physical server memory in use by the directory cache buffers in the NSS or traditional NetWare file system.

Links to the File System Cache Statistics page that shows the details of these cache statistics. Monitoring these statistics over time helps you determine when you might need to install more RAM for cache. See the online help for details of each of the statistics on this page.

Extended File System Memory

Shows the amount of physical extended memory (above 4 GB) that is in use by the NSS file system.

Virtual Memory System

Shows how much physical memory the virtual memory system is using. The state of the virtual memory system can quickly be determined by the amount of physical memory backing the virtual memory system.

Links to the Virtual Memory Health Information page:

  • Physical memory: The amount of physical memory backing the virtual memory system.

  • Memory swapped to disk: The amount of virtual memory swapped to disk and not backed by the virtual memory system.

  • Total bytes in virtual memory: The amount of virtual memory that has been used.

Link to Other Pages:

  • Swap File Information page: Shows the amount of hard disk space that has been allocated as a virtual memory swap file.

    If you find that your server is swapping to virtual memory and its performance is suffering because of it, add more memory to the server.

  • Virtual Memory Cache Pool page: Shows statistics for the physical memory cache pool, virtual memory cache pool, and individual cache pools. See the online help on this page for details about each of these statistics.

  • Virtual Memory Statistics page: Shows specific statistics related to virtual memory and provides links to the Virtual Memory Cache Pool page and Virtual Memory Health page.

Extended Virtual Memory System

Shows the amount of extended (above 4 GB) physical memory that the virtual memory system is using.

Free Memory

Shows how much memory the server has that is not allocated or reserved as file system cache.

You can view the total available memory on the Health Monitor page, including the file system cache memory that is not in use.

DOS, Video, Misc. Memory

Shows how much physical memory is in use before the NetWare operating system loads.

Extended Server Memory In Use

In servers that have greater than 4 GB of physical memory loaded, this shows the amount of memory in use and links to the Extended Server Memory Information page that shows the amount of memory in use and available amounts above 4 GB, along with a usage chart.

Total System Memory

Shows how much total physical memory the server has.

Logical Address Space Usage table

Shows the logical address space information for the NetWare kernel including space in use, free, fragmented, and reserved for User Spaces and OS data. It also shows the peak usage for User Space and the total amount of address space. The User Space reserve is commonly known as Protected Address Space and it always reserves 1 GB of memory whether it is used or not.

Tune Logical Address Space link

Displays the Tune Logical Address Space page that shows the Set parameters to change for best memory performance under the current conditions for that specific server.

To make the changes, click the Change link next to the parameter you want to accept the changes for and restart the server with the -u command displayed.

Use caution when changing these parameters because they are determined to provide the best results for the server while it has been running. If the way the server is used changes, you might have to reset these settings.

The settings are generated dynamically for the specific service at the use level of the server and should not be replicated to any other server.
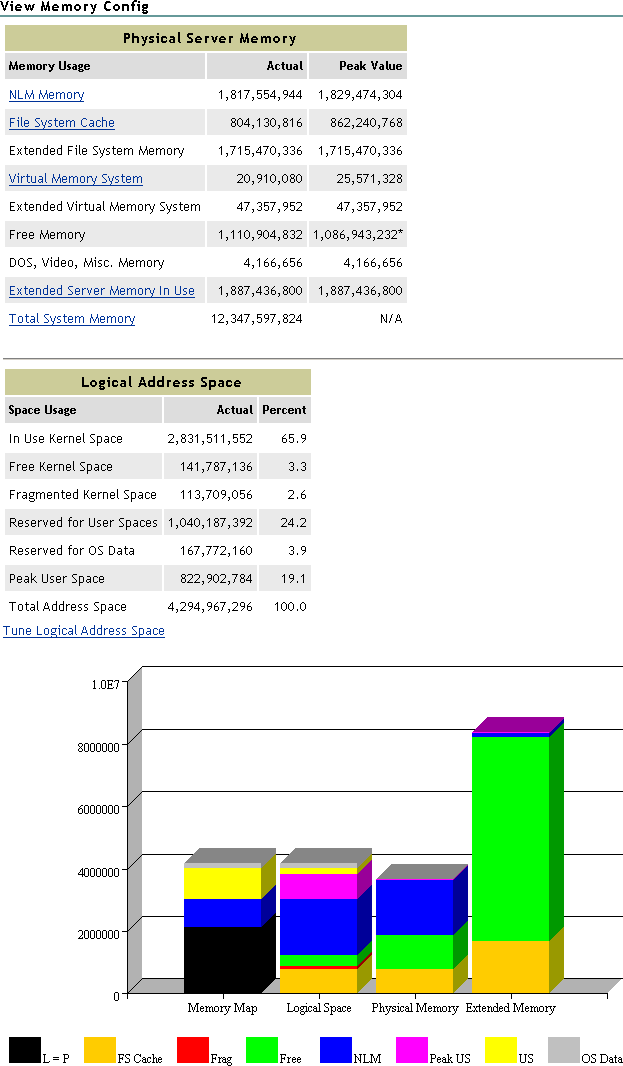
Bar Chart

Shows how the logical address space is mapping the physical memory on this machine.

  • Memory Map: Shows how the logical address space is set up to run on this machine

  • Logical Space: Shows how the actual logical address space is being used on this machine.

  • Physical Memory: Shows how the physical memory with addresses smaller than 4 GB are being used on this machine.

  • Extended Memory: Shows how the physical memory with addresses larger than or equal to 4 GB are being used on this machine.

  • L=P: The amount of logical address space that is reserved for mappings of logical equal physical memory. This memory is primarily used for file cache, but some drivers and NLM programs still require it. This size of the logical equals physical memory pool can be changed by using the File Cache Maximum Size Set parameter. Increasing this pool decreases the NLM Memory pool.

  • FS Cache: The amount of memory being used for the file system cache. This color on the Extended Memory bar chart shows the amount of extended memory being used by the file system.

  • Frag: The amount of logical address space that is still available but is in sizes smaller than 4 MB.

  • Free: The amount of logical address space or physical memory that is available. The available file system cache memory is not included in this metric.

  • NLM: The amount of logical address space or physical memory that is being used by NLM programs. This value includes allocation, stack, code and data memory.

  • Peak US: The peak amount of logical address space that has been used in the User address space. On the Physical Memory and Extended Memory chart, this is the amount of physical memory backing all applications running in User space.

  • US: The amount of logical user address space reserved for running applications in User space or ring 3. You can change the size of the User address space by using the -u switch when issuing the server command. For example, to set the User space size to 500 MB, use the following command when starting the server: server -u500000000

  • OS Data: The amount of logical address space reserved on the Logical Space bar or physical memory being used on the Physical Memory bar for various Operating system data. This data is used to manage both the physical and virtual memory being used on the system.

For more information about server memory, see the NW 6.5 SP8: Server Memory Administration Guide.