10.3 Using the Network Operations Center Dashboard
The Network Operations Center Dashboard presents the following information:
Figure 10-1 The Network Operations Center Dashboard
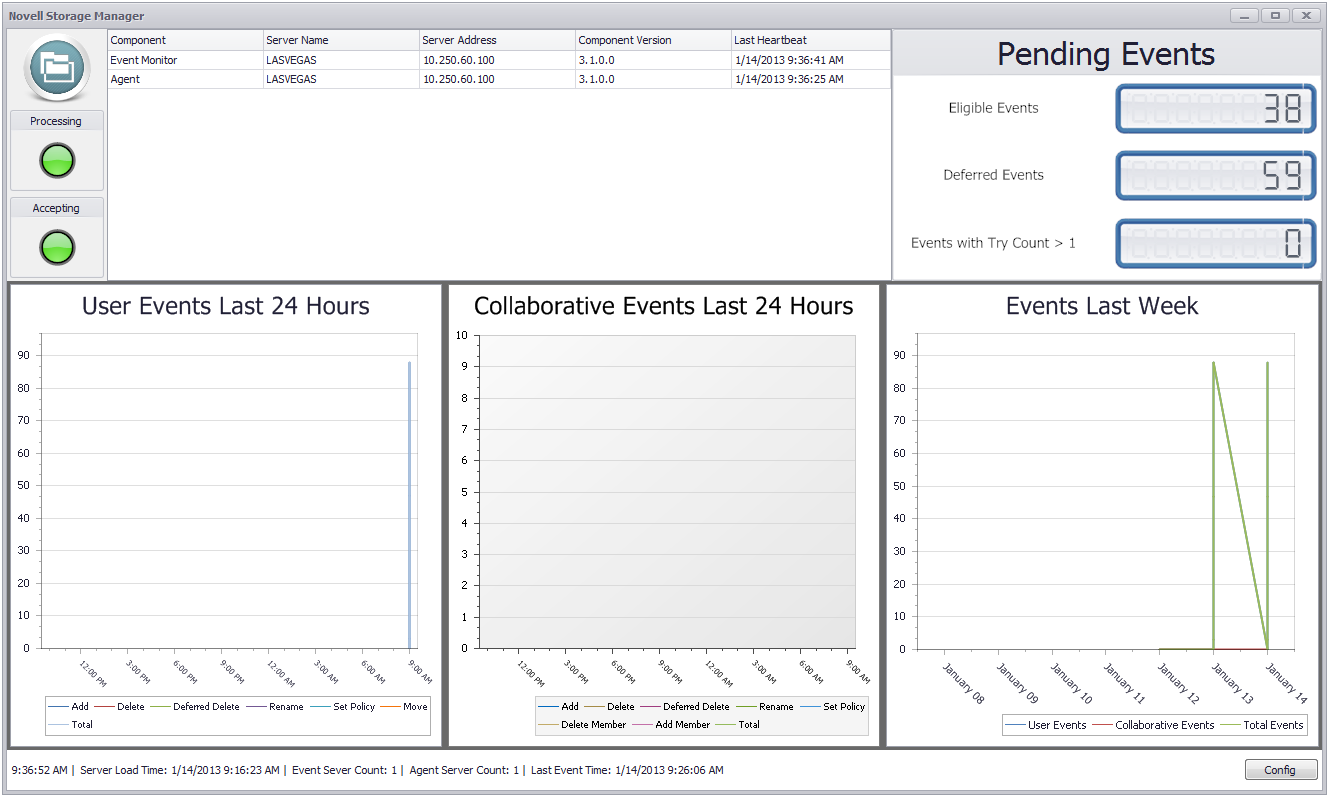
Processing: Displays a green light if the NSM Engine is processing events. A red light indicates that the NSM Engine is not processing events.
Accepting: Displays a green light if the NSM Engine is accepting events from the Event Monitor. A red light indicates the NSM Engine is not accepting events for processing.
Components: Displays all Event Monitors and NSM Agents and relevant data for each.
Pending Events: Displays the eligible events, deferred events, and the number of events that are greater than the try count setting you established in Step 5.
User Events Last 24 Hours: Graphs the user storage events that have taken place in the last 24 hours. Each user event is graphed with a different colored line. You can mouse over a given hour on the graph to see how many events in each category took place at that hour.
Collaborative Events Last 24 Hours: Graphs the collaborative storage events that have taken place in the last 24 hours. Each collaborative event is graphed with a different colored line. You can mouse over a given hour on the graph to see how many events in each category took place at that hour.
Events Last Week: Graphs the total number of user storage and collaborative storage events that have taken place in the last 24 hours. Each category is graphed with a different colored line. You can mouse over a given hour on the graph to see how many events in each category took place at that hour.