11.2 Installing and Configuring the Network Operations Center Dashboard
Perform the following procedures on each computer where you want to run the dashboard.
-
From the Novell Storage Manager 3.1.1 ISO image, copy the Utilities\Dashboard\NSMDashboard.zip file to the computer.
-
Unzip the NSMDashboard.zip file.
-
Launch the NSMDashboard.exe file.
The configuration screen appears.
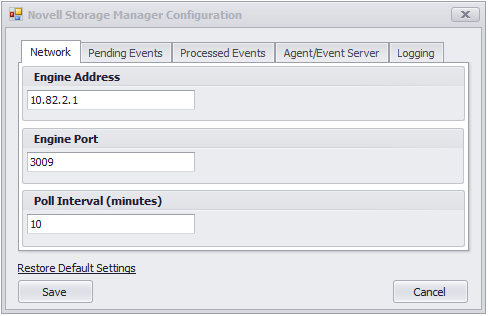
Engine Address: The IP address of the server hosting the NSM Engine.
Engine Port: The port number used by Novell Storage Manager.
The default port number for Novell Storage Manager is 3009.
Poll Interval (minutes): The number of minutes before an update.
Because each update utilizes the database, it can affect Novell Storage Manager performance. We recommend using a higher number of minutes.
-
Specify your settings and click .
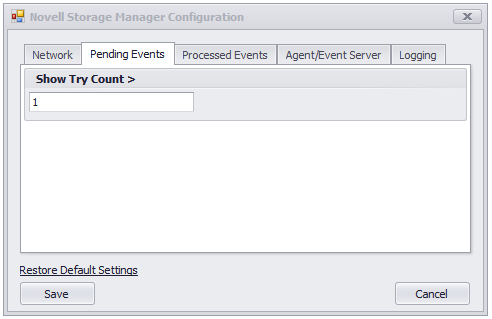
The dashboard displays the number of pending events with try counts greater than the number in the field.
-
Specify your preferred number and click .
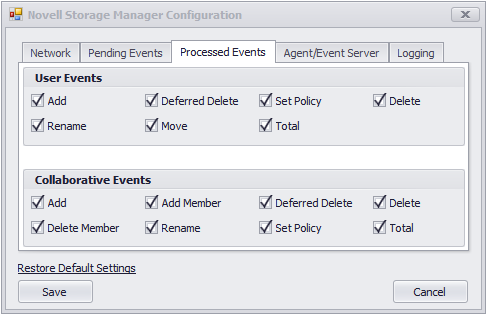
The information displayed on the dashboard depends on events that are being processed. You specify which events to process in this page.
-
Specify which events to process and click .
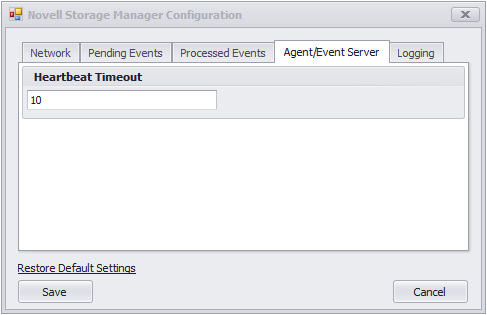
The dashboard displays NSM Agents and Event Monitors that have not generated a heartbeat after the number of minutes set in the field.
-
Set the heartbeat timeout number and click .
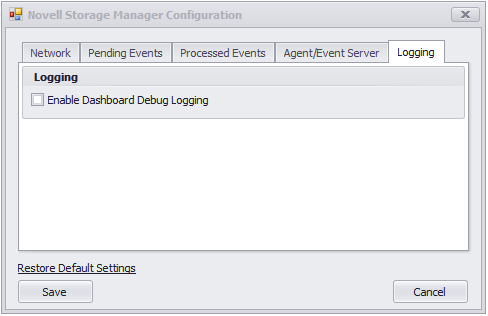
Because logging can quickly fill up disk space, this option is turned off. During a call with a Novell Support representative, you might be asked to turn this on.
-
Click to save the configuration settings.
If you want to change the configuration settings, you can do so by clicking the button.