4.9 Configuring Patch Dashboard and Trending Behavior
-
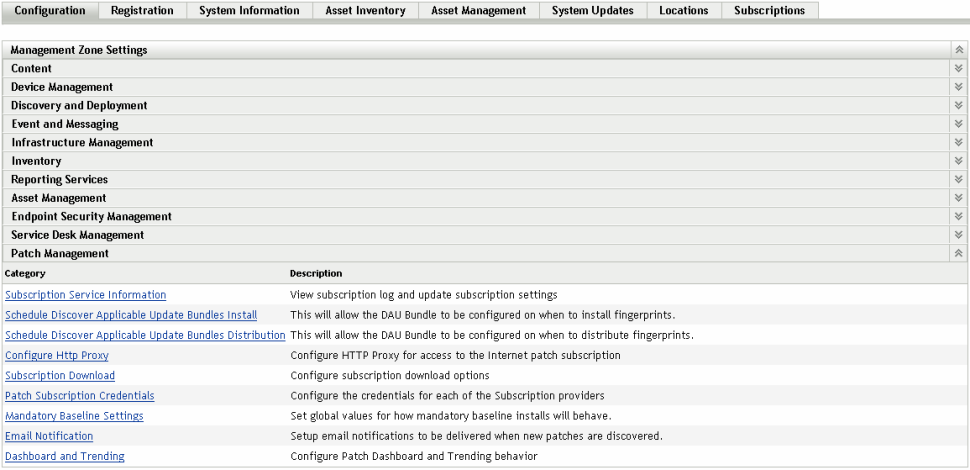
Click the tab in the left panel to display the Configuration page:

-
Click to display the eight links (Subscription Service Information, Schedule Discover Applicable Update Bundles Install, Schedule Discover Applicable Update Bundles Distribution, Configure HTTP Proxy, Subscription Download, Patch Subscription Credentials, Mandatory Baseline Settings, Email Notification, Dashboard and Trending, and Deployment Options):
-
Click the link to open the Dashboard and Trending page.

The Dashboard and Trending page allows you to configure the Patch Dashboard and trending behavior for the Patch Management Server, according to the patch criticality status. You can decide the time when the Dashboard receives daily updates. This page also enables you to specify the number of days the Patch Management Server database stores Dashboard and Trending information.
The following table describes each option on the Dashboard and Trending page:
Item
Description
The time at which the patch Dashboard retrieves updates.
Enables you to specify for how many days the database stores Dashboard information.
Lets you select the impact status of patches for which Dashboard information will be collected. Depending on the impacts you select, the Patch Compliance by Device Dashboard report will display the data.
If you want to turn off data collection for the dashboard, select 0 days in the in database field.
The following table describes the action of each button on the page:
|
Button |
Action |
|---|---|
|
|
Enables you to go back to the Configuration page. |
|
|
Enables you to save the changes made to the page. |
|
|
Enables you to reset the selected options. |
|
|
Enables you to cancel the last action performed. |
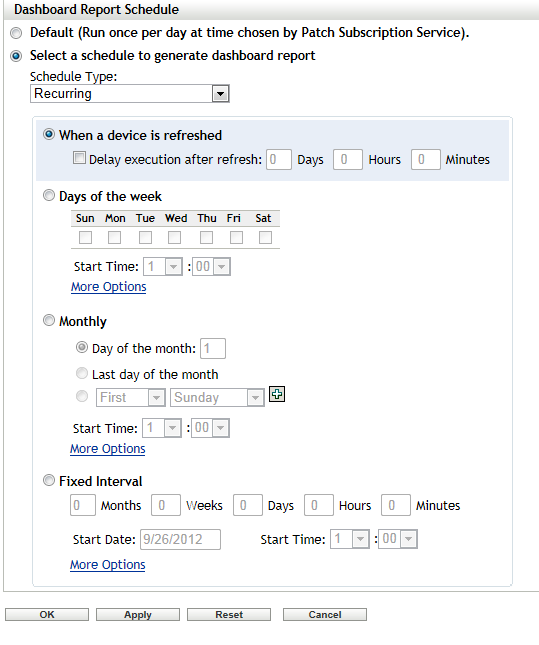
The Dashboard report can be scheduled in the same way as a Deployment. There are 3 ways to generate a schedule for the Dashboard Report
-
Default: Selecting schedules the report at a time chosen by the Patch Subscription Service.
-
Date Specific: Selecting schedules the report according to the selected date. Further options can set the time and frequency of the report
-
Recurring: Selecting schedules the report on the selected day at the selected time, and produces the report: On Refresh, Every day/week/month, and if defined, ends on a specific date. There are also options for producing the report on a Fixed Interval.