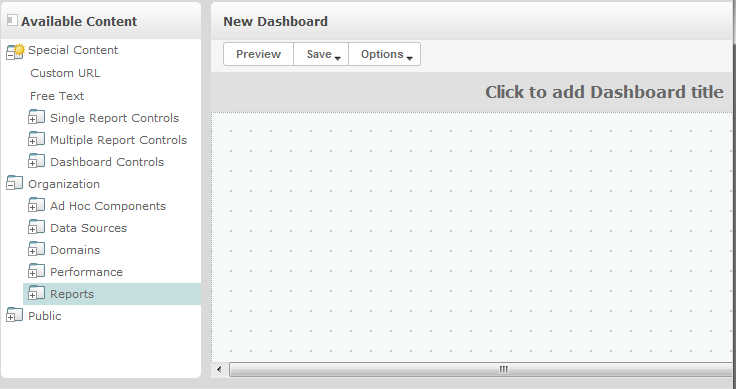
3.1 Creating a Dashboard
-
Click .
-
In the pane, navigate to the required folder, right-click the report name, and click , or drag and drop the report from to .
-
Right-click the report, then click .
You can save the dashboard even though its content exceeds the canvas area. In the mode, if content exceeds the canvas area, you must scroll to see the entire dashboard. For more information, see Section 3.2.3, About Screen Sizes.
-
To view the entire dashboard with the selected resolution, without scrolling:
-
Place the cursor on the report, then click and move towards the right-hand, lower edge of the frame.
-
When the resizing icon
 is displayed, click and drag the edge of the frame to resize it until the required view appears.
For smoother cursor movement, press the Ctrl key while dragging or resizing items and frames.
-
-
Right-click the report, then click or .
Use for charts and small crosstabs to resize the frame to fit its content.
-
Click , or click to save as a new version.
-
Specify the name, then save the dashboard in the required folder where you have access permissions.
NOTE:While creating a dashboard, you can add an input control. For more information, see Section 3.2.1, Adding Controls to a Dashboard.