5.2 Dashboard
NOTE:To use patch management effectively, customers should disable the patches that are irrelevant to their environment, so that the daily compliance statistics are based only on patches relevant to their network of devices, giving the percentage of enabled patches actually applied on a given day.
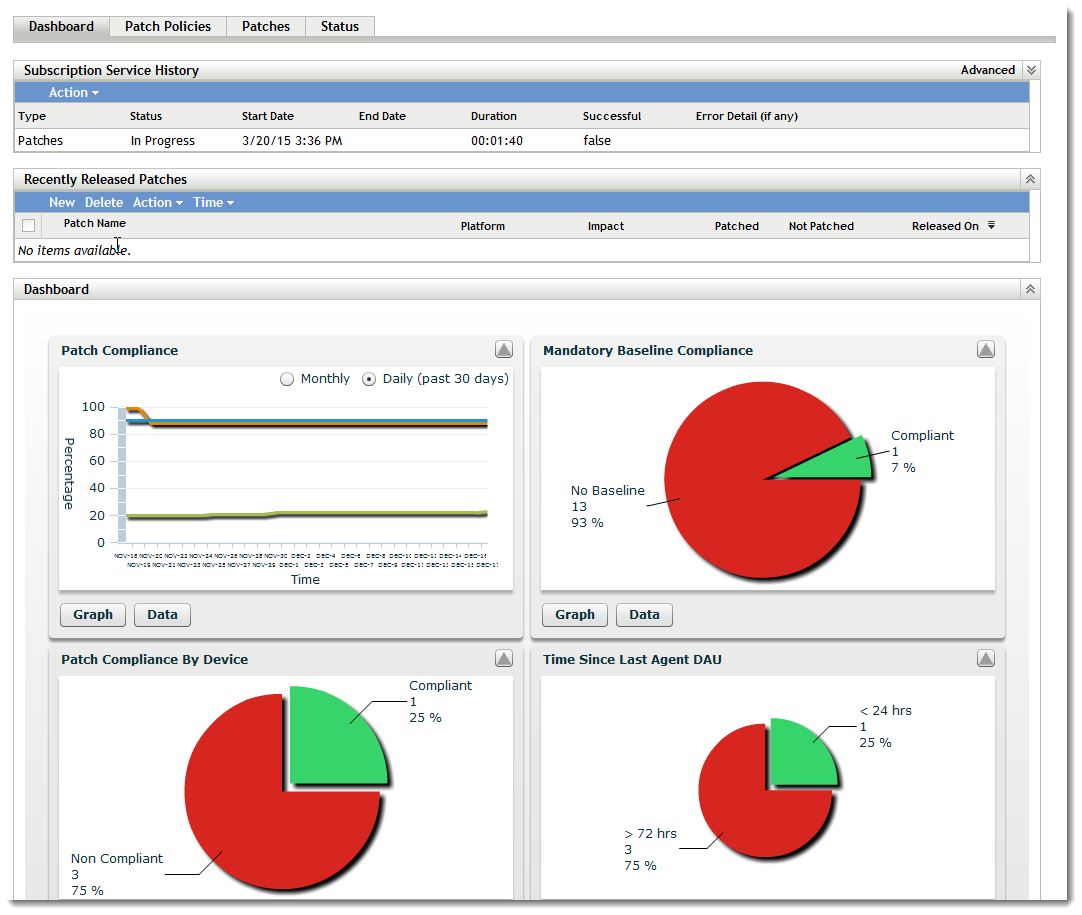
Following is an illustration of the Dashboard page:
Figure 5-3 Dashboard Page
The section displays the activity log of the subscription activities. The following table describes each item featured in this section.
|
Item |
Definition |
|---|---|
|
|
Subscription type defined for your account: Patches (Subscription Replication), Bundles (Subscription Replication), and Licenses. |
|
|
Status of the replication. When replication begins, the status reads . When replication ends, the status reads . NOTE:If the replication process is interrupted, the status reads . This indicates that the replication process has continued from the point where it was interrupted. |
|
|
The date and time when replication started. |
|
|
The date and time when replication ended. |
|
|
The length of time the replication has been going on. |
|
|
Indicates whether the replication was successful or not. indicates successful replication and indicates incomplete or failed replication. |
|
|
Details of any error encountered during the patch download process. |
lists the last ten patches that were downloaded by the subscription service.
|
item |
Definition |
|---|---|
|
|
The name of the patch. |
|
|
The operating system that the patch applies to. |
|
|
The impact of the patch. |
|
|
The number of devices that the patch has been installed on. |
|
|
The number of devices that the patch has not been installed on. |
|
|
The date that the patch was released. |
The addresses operational, management, and compliance reporting needs with a graphical dashboard and four standard reports that document patches, patch deployments, patch status, trends, inventory and more, at individual machine or aggregated levels. This provides a unified view to demonstrate progress toward internal and external audit and compliance requirements. Clicking a dashboard report will display more information about that report in tabular form. You can update the dashboard by clicking the button in the menu of the tab.
The dashboard reporting thread captures daily statistics concerning the overall percentage of enabled patches that are actually patched on a given day. It will take at least 24 hours for the initial dashboard reports to be generated.
-
Patch Compliance: Displays the monthly [or daily] trend of overall compliance for each patch impact category.
Patch Management best practices recommend that an organization should monitor compliance reports over time to ensure that the intended patches are deployed regularly and the patch management solution is being used correctly. Mouse over the trend lines to see the actual calculated percentages for each impact category (Critical, Software, or Optional). Detailed drill-down information showing the individual patched / not patched totals per patch can be seen on the tab of
-
Month [or Day]: Time period
-
Critical Patched: Percentage of critical patches that are patched
-
Optional Patched: Percentage of Recommended and Informational patches that are patched
-
Software Patched: Percentage of Software patches that are patched
-
-
Mandatory Baseline Compliance: Displays the percentage of device groups that are currently in mandatory baseline compliance.
Establishing a mandatory baseline policy allows the administrator to auto-deploy patches to device groups very quickly and easily, and to ensure that known vulnerabilities do not return when a new computer is purchased or re-imaged. Each group is evaluated as being in mandatory baseline compliance if all enabled baseline patches for that group are currently in a patched status for all group member devices.
-
Status: Compliant, Non-Compliant or No Baseline
-
Group Count: Number of groups in each state
-
-
Patch Compliance By Device: Displays the overall patch compliance of the devices that ZENworks Patch Management is monitoring.
Each device will only be evaluated as “compliant” if it has a patched status for all of the active patches currently available within Patch Management. It is recommended that patches that are not applicable should always be disabled within Patch Management so that this metric can track only the relevant patches for the managed network of devices.
-
Status: Compliant or Non-Compliant
-
Device Count: Total number of devices in each state
-
-
Time Since Last Agent DAU: Displays the elapsed time since the last refresh cycle for all managed devices within the network.
Within a patch management system, it is vital to ensure that all devices are scanned regularly for missing patches. Even with a regular daily refresh cycle, it is very likely that some laptops or workstations will be offline during any given day.
-
Elapsed Time: < 24 hrs, < 48 hrs, < 72 hrs, > 72 hrs, above custom time
-
Device Count: Total number of devices in each category
-
The following table describes the action of each button on the page:
|
Button Name |
Action |
|---|---|
|
|
Displays the details graphically. |
|
|
Displays the details in tabular form. |
|
|
Enlarges or reduces a single graph into the full page size or restores it to the original size. |
|
|
Refreshes the Dashboard page to show the updated information. |
When you click the  button, the corresponding graph is in full page size mode; when you click the
  button, the corresponding graph is restored to its former size.