4.6 Configuring Patch Dashboard and Trending Behavior
-
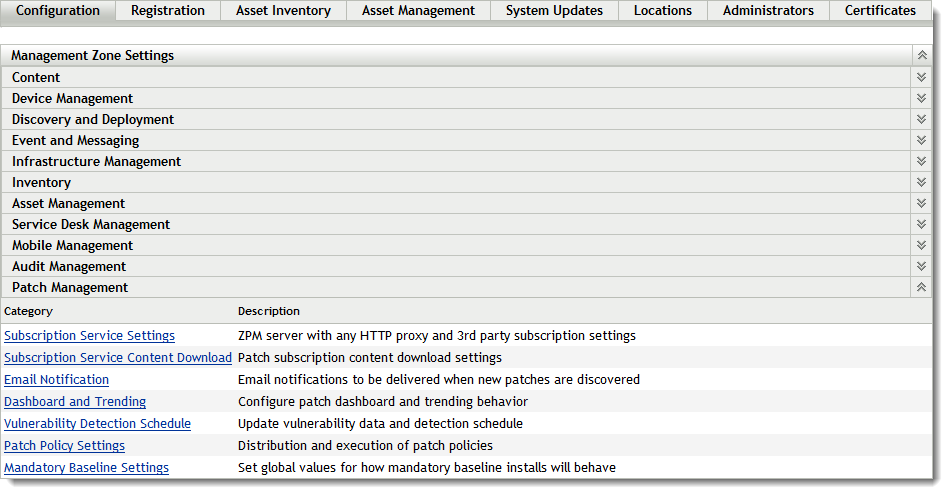
Click the tab in the left panel to display the Configuration page:

-
Click to display the seven links (Subscription Service Settings, Subscription Service Content Download, Email Notification, Dashboard and Trending, Vulnerability Detection Schedule, Patch Policy Settings, Mandatory Baseline Settings):
-
Click the link to open the Dashboard and Trending page.

The Dashboard and Trending page allows you to configure the Patch Dashboard and trending behavior for the Patch Management Server, according to the patch impact status. You can decide the time when the Dashboard receives daily updates. This page also enables you to specify the number of days the Patch Management Server database stores Dashboard and Trending information.
The following table describes each option on the Dashboard and Trending page:
Item
Description
Enables you to specify for how many days the database stores Dashboard information.This information is then used to create dashboard and graph information.If you want to turn off data collection for the dashboard, select 0 days.
This section also includes a check box for saving a record of patch status history for every day in your database (this data is also used to show trends in the dashboard graph). Enterprises with 10k+ nodes shouldn’t use this option because when the data for all nodes and patches is saved, it can consume a large amount of your database very quickly.
Lets you select the impact status of patches for which Dashboard information will be collected. Depending on the impacts you select, the Patch Compliance by Device Dashboard report will display the data.
The interval at which the Patch Agent status report refilters itself.
The schedule by which the patch Dashboard retrieves updates. You can either choose the option (which will update the dashboard once daily) or (which lets you choose a custom schedule).
If you want to turn off data collection for the dashboard, select 0 days in the in database field.
The following table describes the action of each button on the page:
|
Button |
Action |
|---|---|
|
|
Enables you to go back to the Configuration page. |
|
|
Enables you to save the changes made to the page. |
|
|
Enables you to reset the selected options. |
|
|
Enables you to cancel the last action performed. |
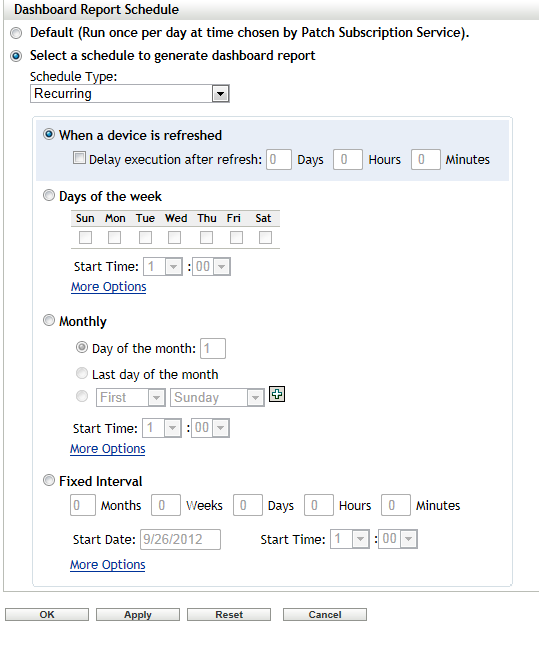
The Dashboard report can be scheduled in the same way as a Deployment. There are 3 ways to generate a schedule for the Dashboard Report
-
Default: Selecting schedules the report at a time chosen by the Patch Subscription Service.
-
Date Specific: Selecting schedules the report according to the selected date. Further options can set the time and frequency of the report
-
Recurring: Selecting schedules the report on the selected day at the selected time, and produces the report: On Refresh, Every day/week/month, and if defined, ends on a specific date. There are also options for producing the report on a Fixed Interval.