Environment
NetIQ eDirectory 9.x for All Platforms
Novell eDirectory 8.8.x for All Platforms
Novell eDirectory 8.8.x for All Platforms
Novell eDirectory 8.7.3 for All Platforms
Situation
How to trace LDAP operations to a screen or log file
Resolution
1. First configure the LDAP Server to provide detailed tracing information on LDAP operations
If eDirectory is running linux, you can turn the screen options on by executing a "ldapconfig set "LDAP Screen Level=all" from a terminal window. Otherwise use iManager to turn on the screen options.
If eDirectory is running linux, you can turn the screen options on by executing a "ldapconfig set "LDAP Screen Level=all" from a terminal window. Otherwise use iManager to turn on the screen options.
a. In iManager go to the LDAP role, then LDAP Options, click on the View LDAP Servers tab, and select your LDAP Server for the server you want to trace.
b. Select the following options and click APPLY:
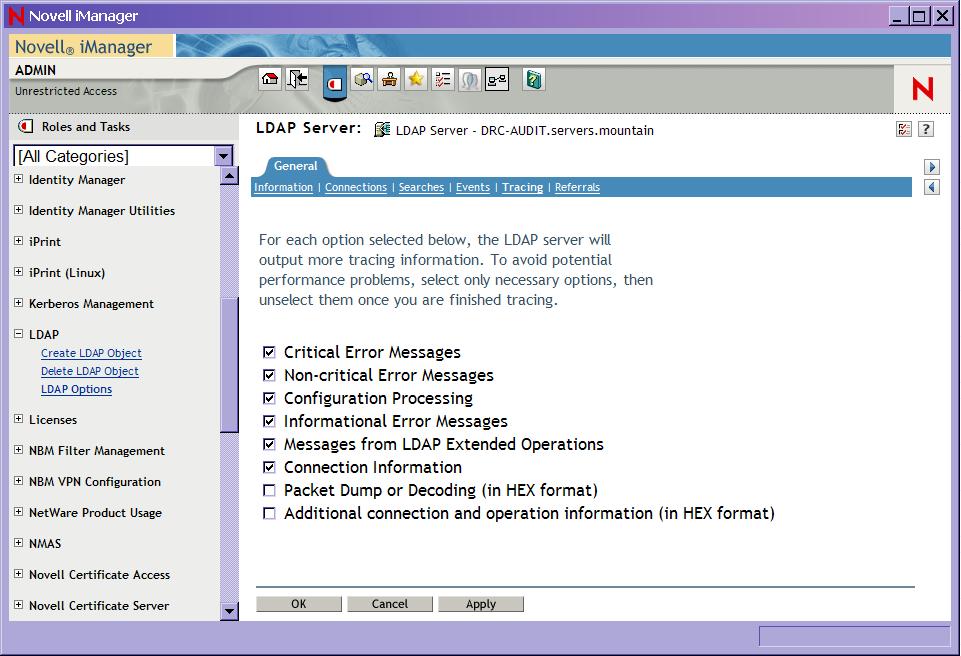
c. Then go back to the information tab (on the LDAP Server object) and click the Refresh button (you may have to scroll down to see it)
2. On the server start dstrace to see the information.
On NetWare, use these commands. (make sure you delete the dstrace.log file first)
dstrace <enter>, dstrace -all <enter>, dstrace + time +tags +ldap <enter>, dstrace screen on file on <enter>
Then run your LDAP process you want to trace.
unload dstrace <enter> will turn off tracing and close the file.
You can then get the trace file at sys:system\dstrace.log
On NT/2000, use these commands. Load the DSTrace utility by double-clicking DSTrace from the NDS Services window on the Control Panel. Choose Edit | Options. Click "Clear All", then click the "LDAP" checkbox. Information is logged to a file using the drop-down FILE menu.
On Linux, use these commands (make sure you delete the ndstrace.log file first) (it helps to oversize your terminal window to see all the ndstrace options prior to starting ndstrace)
ndstrace <enter>, set ndstrace=nodebug <enter>, ndstrace +time +tags +ldap<enter>, ndstrace file on screen on
Then run your LDAP process you want to trace.
exit <enter> will turn off tracing and close the file.
You can then get the trace file at (OES1) /var/nds/ndstrace.log (OES2) /var/opt/novell/eDirectory/log/ndstrace.log
3. iMonitor provides a method of capturing the LDAP activity that works with every supported platform. If sending a trace into technical support, DO NOT USE iMonitor to capture the trace unless instructed explicitly to do so.