3.2 Introduction to the User Interface
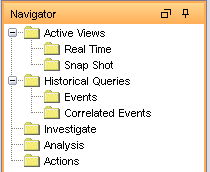
In an Active Views, you can see , , and . You can navigate to these functions from:
Table 3-1 Active Views User Interface
|
User Interface |
Description |
|---|---|

|
The menu in the menu bar |

|
When you create a filter, the menu has these additional options. |
|
The Navigation tree in the Navigation pane |

|
The toolbar buttons |
Active Views provides two types of views that display the events in tables and graphs.
-
The Table format displays the variables of the events as columns in a table. You can sort the information in the grid by clicking the column name.
Figure 3-1 Active View Tabular Format

-
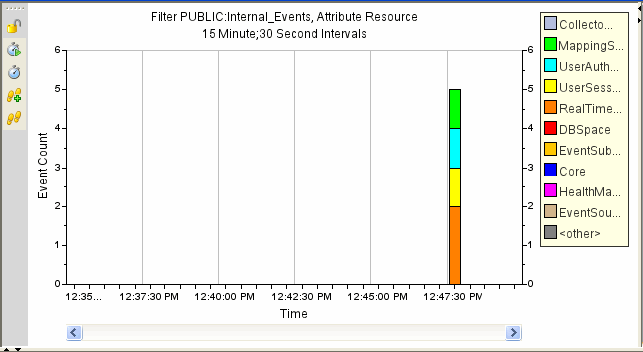
The Graphical format displays events as graphs. You can change the chart types to display other chart types.
Figure 3-2 Active View Graphical Format
There are two types of Active Views:
-
Near Real Time Event Table:
-
Holds up to 750 events per 30-second period. If there are more than 750 events, the events are displayed in the following priority order: correlated events, events that are sent to the GUI by using a global filter, and all remaining events.
-
By default, the client maintains a 24-hour period of cached events. This is configurable through Active View Properties.
-
By default, the smallest possible display interval of an active view is 30 seconds. This is represented by a gray line in the event table.
Figure 3-3 Gray Line Smallest Possible Display Interval

If there are more than 750 events per 30-second time period, a red separation line displays indicating that there are more events than are displayed. The other events can be viewed by using Historical Queries.
Figure 3-4 Red Line More Events Displayed

-
On saving user preferences, the system continues to collect data for four days. For instance, if you save your preferences, log out, and log back in the following day, your Active View displays data as if you never logged off.
-
If an Active View is created and not saved, it continues to collect data for an hour. If an identical Active View is created within that hour, the Active View displays data for the last hour.
-
-
Snapshot: Time-stamped views of a Real Time Event View table.
Active View provides the following unique features:
-
Filter assigned to an Active View
-
The z-axis attribute
-
The security filter assigned to a user
The tab allows you to:
-
Reconfigure total display time
-
Add events to an incident
-
Close a Snapshot or Navigator window
-
Create an incident
-
Custom menu options with events
-
Investigate an event query
-
Investigate a graph map
-
View Advisor data
-
Manage columns Send messages about events by e-mail
-
Show or hide event details
-
Take a Snapshot of a Navigator window
-
View events that triggered a correlated event
-
View vulnerability visualization
-
View asset data
-
Integrate with the ticketing system
You can change labels (column names) to user-friendly names and the new names are populated throughout the system. For more information, see Section 3.15, Using Custom Menu Options with Events.