13.5 Viewing the Pair History
The tab in a pair’s Statistics dialog box shows the amount of space consumed over time on the devices that are used in a pair. You can view a summary of a particular scan event by the file extension, file size, last modified, and creation time. You can display each of these graphs by total size consumed or by the number of files. Each scan event opens in a separate window so that you view and compare multiple events. Sizes are reported in binary units (for example, 1 MB is 1024 bytes).
By default, the pair history scan runs once daily at 4:00 a.m. This setting is configurable. For information, see Section 8.10, Scheduling the Pair History Scan.
For information about the storage status and history for the disks that are used in a pair, see Section 13.6, Viewing the Server Disk Capacity and Used Space History.
-
In the Management Console, connect to the DynamicFS server that you want to manage.
-
Under the folder, double-click the pair name to open the Statistics dialog box, then select the tab.
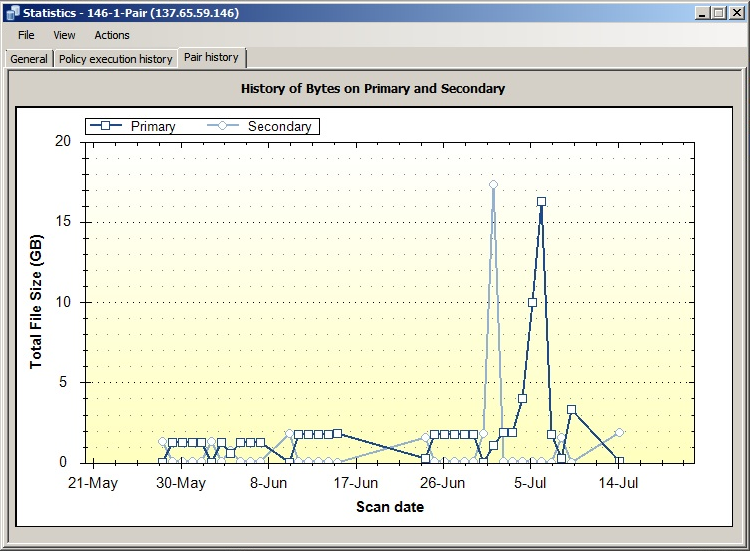
The Pair History graph shows the total file size over time for the primary location (a dark blue square icon) and the secondary location (a light blue circle icon). A scan event is recorded for each time that the Pair History scan is run.
-
Double-click the scan event for the primary (a dark blue square icon) location or the secondary location (a light blue circle icon) to open a graphical summary of the scan in a separate dialog box.
A graph of the scan is displayed by file extension and total file size of all the files moved in that category.
-
In a Summary dialog box, modify the display parameters to view the information of interest:
-
Select (default) to view the information organized by file size in the categories.
-
Select to view the information organized by number of files in the categories.
-
In the drop-down box, select one of the following parameters to modify the information that is displayed:
-
Creation
-
Accessed
-
Modified
-
File Size
-
Extension (default)
-
-
-
(Optional) Save a graphic display by right-clicking anywhere in a graphical area and selecting one of the following options:
-
Copy: Copies the selected graph as an image to the clipboard. Open a graphics editor, paste the image, and save the file.
-
Save Image As: Opens a Windows Save As dialog box where you can specify a location and file name for the image, select a file format, then save the file.
-
Page Setup: Set up the page orientation (portrait or landscape) and printer information for printing the graph.
-
Print: Print the selected graph.
-
-
(Optional) Compare multiple scan events by opening their Summary dialog boxes side-by-side.