3.1 Interface, Current Status, and Latest Event Log Information
This table displays the different interfaces of the iPrint Manager.
Interface: Contains links to pages that display statistics to profiled time and errors for the indicated interfaces.
Current Status: Indicates the state of each interface for the last hour.
Table 3-1 Interface Color Indicators
|
Status |
Description |
|---|---|
|
Bad |
Color: Red Running outside configured thresholds in a manner designated as an error. |
|
Good |
Color: Green Running within configured thresholds. |
|
Not Monitored |
Monitoring for the interface has been turned off or does not apply. |
|
Warning |
Color: Yellow Running outside configured thresholds in a manner designated as a warning. |
Figure 3-2 Latest Event Log
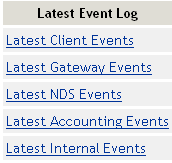
Latest Event Log: Displays the last 20 events for the given interface. You can choose to view the last 20 client events, gateway events, NDS events, accounting events, and internal events.
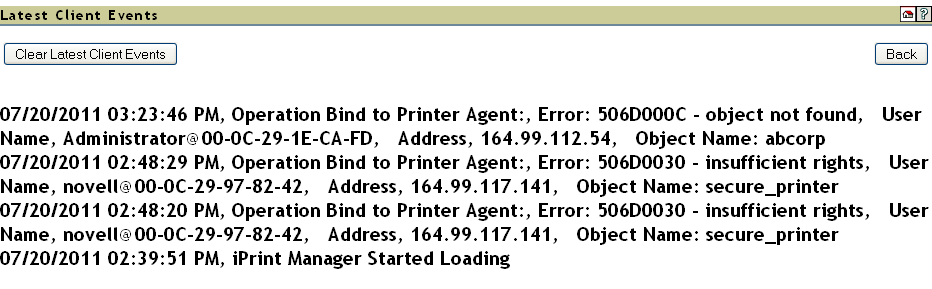
Figure 3-3 Latest Client Events
3.1.1 Client Interface
Figure 3-4 Client Interface Page
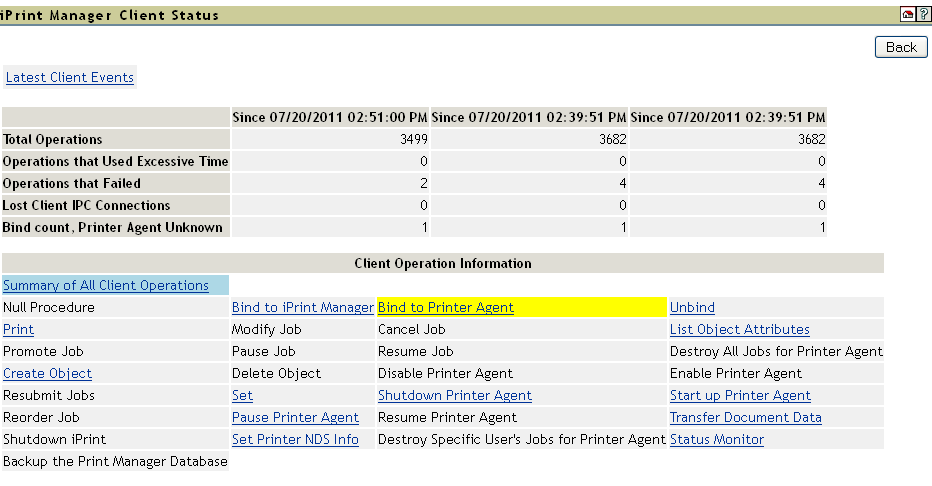
Latest Client Events
Displays the last 20 events for the given interface.
Currently Bound Clients
Displays statistics on clients currently bound to this iPrint Manager. Typically, most binds are transitory except for administrators that are using management tools.
Client Operations Statistics
Displays statistics regarding the operations that have occurred since the referenced time, typically in the last hour, since midnight, and since the Printer Agent was started.
Table 3-2 Client Operations
|
Statistic |
Description |
|---|---|
|
|
Total number of client operations that have occurred since the referenced time. |
|
|
Number of client operations that succeeded, but exceeded the configured threshold for maximum client operation time. |
|
|
Number of client operations that failed. |
|
|
Average time used to perform operations of the selected type. |
|
|
Maximum time used to perform an operation of the selected type. |
|
|
Number of times the iPrint Manager attempts to respond to a request when the client is no longer communicating. Causes for the lost client connection include slow links or routers and a client machine being rebooted. This statistic can indicate when users are having difficulty printing. This displays only when you select Summary of All Operations. |
Client Operation Information
Lists all of the client operations that might occur with the iPrint Manager. These operations become selectable if any operation of that type has occurred. The statistics at the top of this page apply to the currently selected field.
When an operation event occurs, the operation is changed to a link. When you click a link, the statistics for that operation for the last hour are displayed above the and the operation is highlighted with the color Cyan. The following are all the colors that can be used.
Table 3-3 Operation Color Indicators
|
Color |
Description |
|---|---|
|
Cyan |
Currently selected event operation |
|
Magenta |
Currently selected event operation with an event worthy of notice |
|
Yellow |
Event worthy of notice has occurred |
3.1.2 Gateway Interface
Figure 3-5 Gateway Interface Page
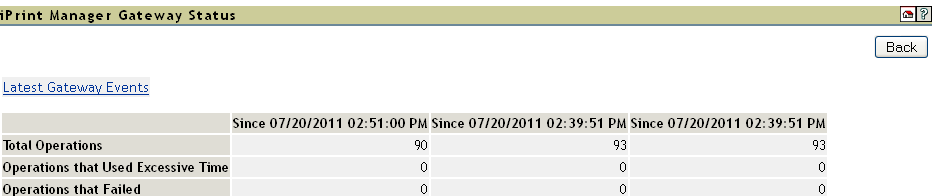
Latest Gateway Events
Displays the last 20 events for the given interface.
Gateway Operations
Displays statistics regarding the operations that have occurred since the referenced time, typically the last hour, since midnight, and since the Printer Agent was started.
Table 3-4 Gateway Operations
|
Statistic |
Description |
|---|---|
|
|
Total number of operations that have occurred since the referenced time. |
|
|
Number of operations that succeeded, but exceeded the configured threshold for maximum client operation time. |
|
|
Number of operations that failed. |
3.1.3 NDS Interface
Figure 3-6 NDS Interface Page
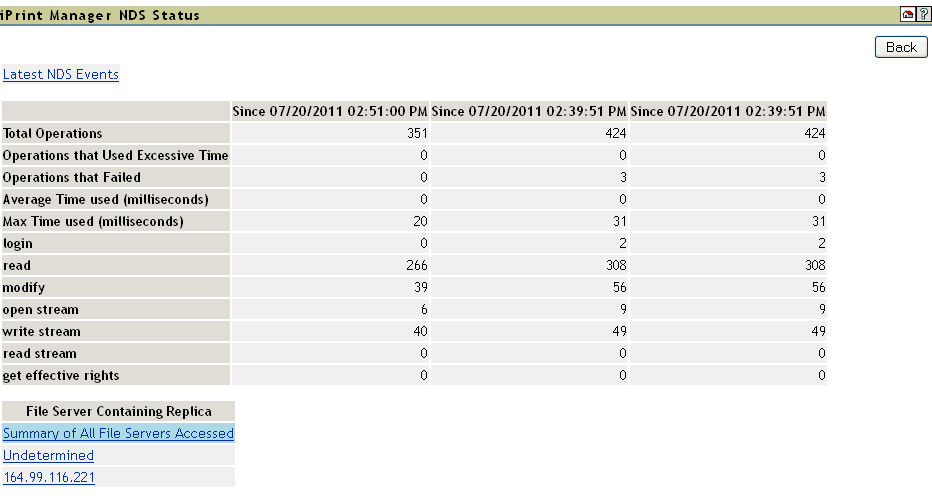
Latest NDS Events
Displays the last 20 events for the given interface.
Operations
Table 3-5 NDS Operations
|
Statistic |
Description |
|---|---|
|
|
Total number of client operations that have occurred since the referenced time. |
|
|
Number of client operations that succeeded, but exceeded the configured threshold for maximum client operation time. |
|
|
Number of client operations that failed. |
|
|
Average time used in milliseconds to perform NDS® operations to the selected server. |
|
|
Maximum time used in milliseconds to perform NDS operations to the selected server. |
|
Login |
Number of times that the user has logged into eDirectory |
|
Read |
Number of times that read operations have been carried out in the eDirectory |
|
Modify |
Number of times that modify operations have been carried out in the eDirectory |
|
Open Stream |
Number of times that the open stream operation has been carried out in the eDirectory |
|
Write Stream |
Number of times that the write stream operation has been carried out in the eDirectory |
|
Read Stream |
Number of times that the read stream operation has been carried out in the eDirectory |
|
Get Effective Rights |
Number of times that requests have been made for obtaining effective user rights for printer objects |
File Server Containing Replica
The statistics on this page apply to the currently selected replica in the list. The links are explained in the following table.
Table 3-6 NDS Replica Information
|
Options |
Description |
|---|---|
|
|
Statistics for all monitored NDS operations. |
|
|
Any operation where the iPrint Manager cannot determine which replica was accessed. |
|
File_Server_List |
The first 15 file servers accessed by the iPrint Manager for NDS information within the last hour. Any server highlighted in yellow indicates that there has been a recent problem while processing an NDS operation to that server. |
Clicking the link displays operations associated with that file server’s replica. The following colors are used.
Table 3-7 Operation Color Indicators
|
Color |
Description |
|---|---|
|
Cyan |
Currently selected event operation. |
|
Magenta |
Currently selected event operation with an event worthy of notice. |
|
Yellow |
An event worthy of notice has occurred. |
Last Access of Replica
If a file server has been selected under , this displays the date and time that the iPrint Manager last accessed a replica on that file server.
Lost Connection Count
Displays the number of times the iPrint Manager unsuccessfully attempted to talk to the selected server. This statistic is indicative of the health of eDirectory™.
3.1.4 Accounting Interface
Figure 3-7 Accounting Status Page
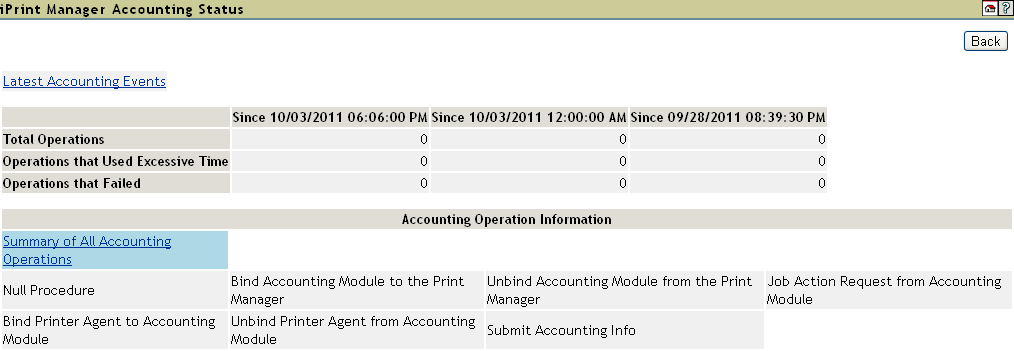
Latest Accounting Events
Displays the last 20 events for the given interface.
Operations
Table 3-8 Accounting Operations
|
Statistic |
Description |
|---|---|
|
|
Total number of accounting operations that have occurred since the referenced time. |
|
|
Number of accounting operations that succeeded, but exceeded the configured threshold for maximum client operation time. |
|
|
Number of accounting operations that failed. |
Accounting Operation Information
Lists all of the accounting operations that might occur with the iPrint Manager. These operations become selectable if any operation of that type has occurred. The statistics at the top of this page apply to the currently selected field.
When an operation event occurs, the operation is changed to a link. When you click a link, the statistics for that operation for the last hour are displayed above the and the operation is highlighted with the color Cyan. The following are all the colors that can be used.
Table 3-9 Operation Color Indicators
|
Color |
Description |
|---|---|
|
Cyan |
Currently selected event operation |
|
Magenta |
Currently selected event operation with an event worthy of notice |
|
Yellow |
Event worthy of notice has occurred |
3.1.5 iPrint Manager Internal
Figure 3-8 Print Services Manager Internal Page
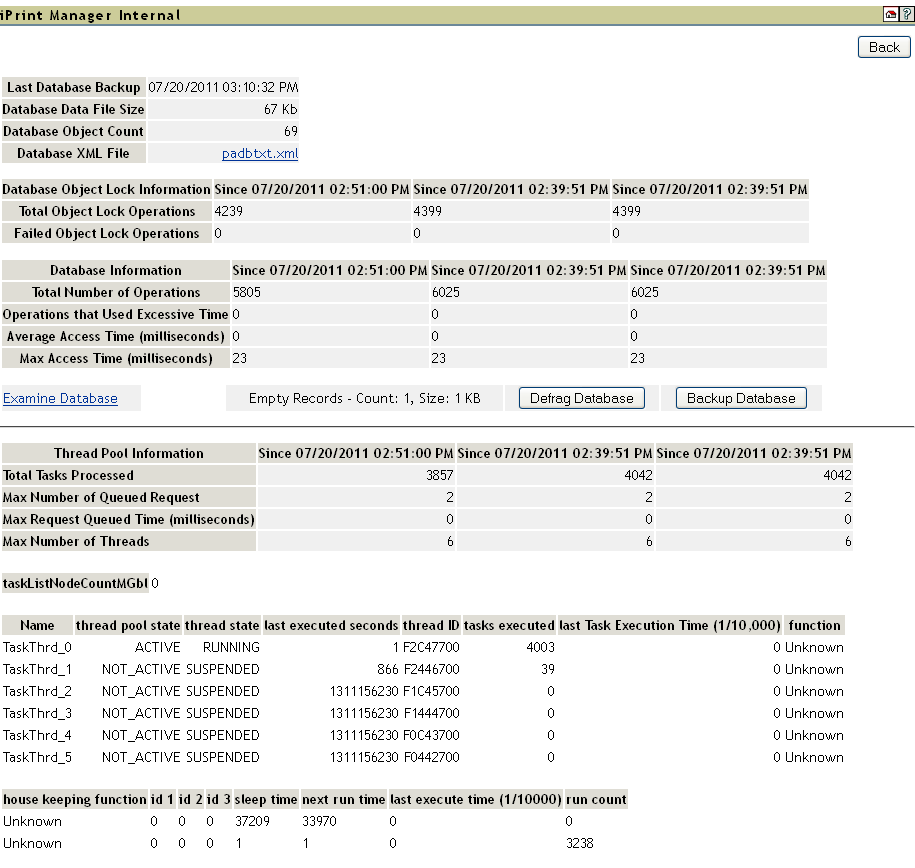
Database Backup and File Size Information
Displays general information about the iPrint Manager’s database. The index file and the data file together comprise the iPrint Manager’s database. The index should be roughly one-tenth the size of the .
A large index file is indicative that a large number of database objects have been deleted. While this does not affect performance, you can resynchronize the database to update the index file size, if necessary.
Database Lock Operations
The iPrint Manager uses locks when accessing objects in its database. If the lock for an object cannot be acquired, the object cannot be accessed and that database operation fails. displays how many object lock operations have been attempted and how many have failed for the specified time.
Database Information
Displays statistics on the performance of the iPrint Manager’s database. Excessive time is defined as 10 seconds. The should be 0 (zero).
Statistics for the are expected, and most entries are associated with file system backups.
Examine Database
Links to a page that gives details about the database objects.
Thread Pool Information
The iPrint Manager has a thread pool that it uses to process a variety of tasks. This table displays some statistics to monitor the performance and load on this thread pool.
Table 3-10 Thread Pool Task Information
|
Statistic |
Description |
|---|---|
|
|
Total number of tasks that have been processed by the thread pool since the referenced time. |
|
|
Maximum number of request that were queued up (waiting) to be processed. |
|
|
Longest time that a task waited to be processed. |
|
|
The iPrint Manager has the ability to create and to destroy threads for the thread pool as needed. The minimum number of threads in the thread pool is two. displays the maximum number of threads that were needed to process tasks. If this number consistently exceeds five, you should monitor the print system’s performance and determine if you need an additional iPrint Manager. |