7.4 Reporting and Monitoring Home Page
On login, Reporting and Monitoring opens to the Home page. The Home page is also accessible through the ‘Home’ button along the top bar. The R&M server has different page links and menus across the top of the menu bar, accessing different functionality. The R&M server has many tables and columns displaying a large amount of information. To make this information more accessible, every column has been made sortable. To sort the columns, simply click on them. They may be sorted to show the highest number first, lowest number first, or not sorted at all.
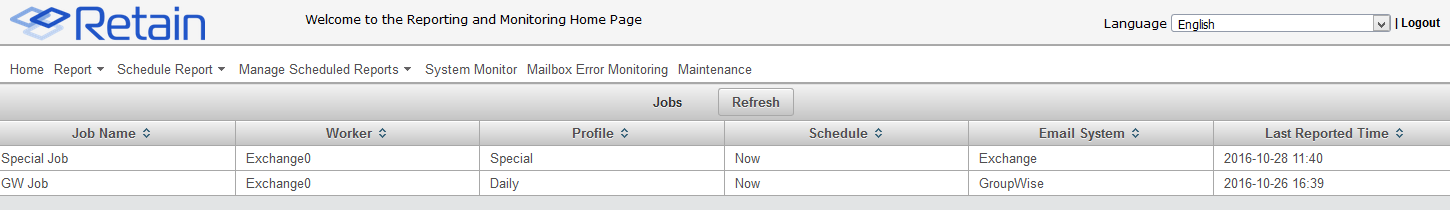
The Home page list the different jobs, associated workers, profiles, schedules, and last reported run times configured for the system. These jobs can be selected to display the job history and detailed information for each instance of when that job was run.
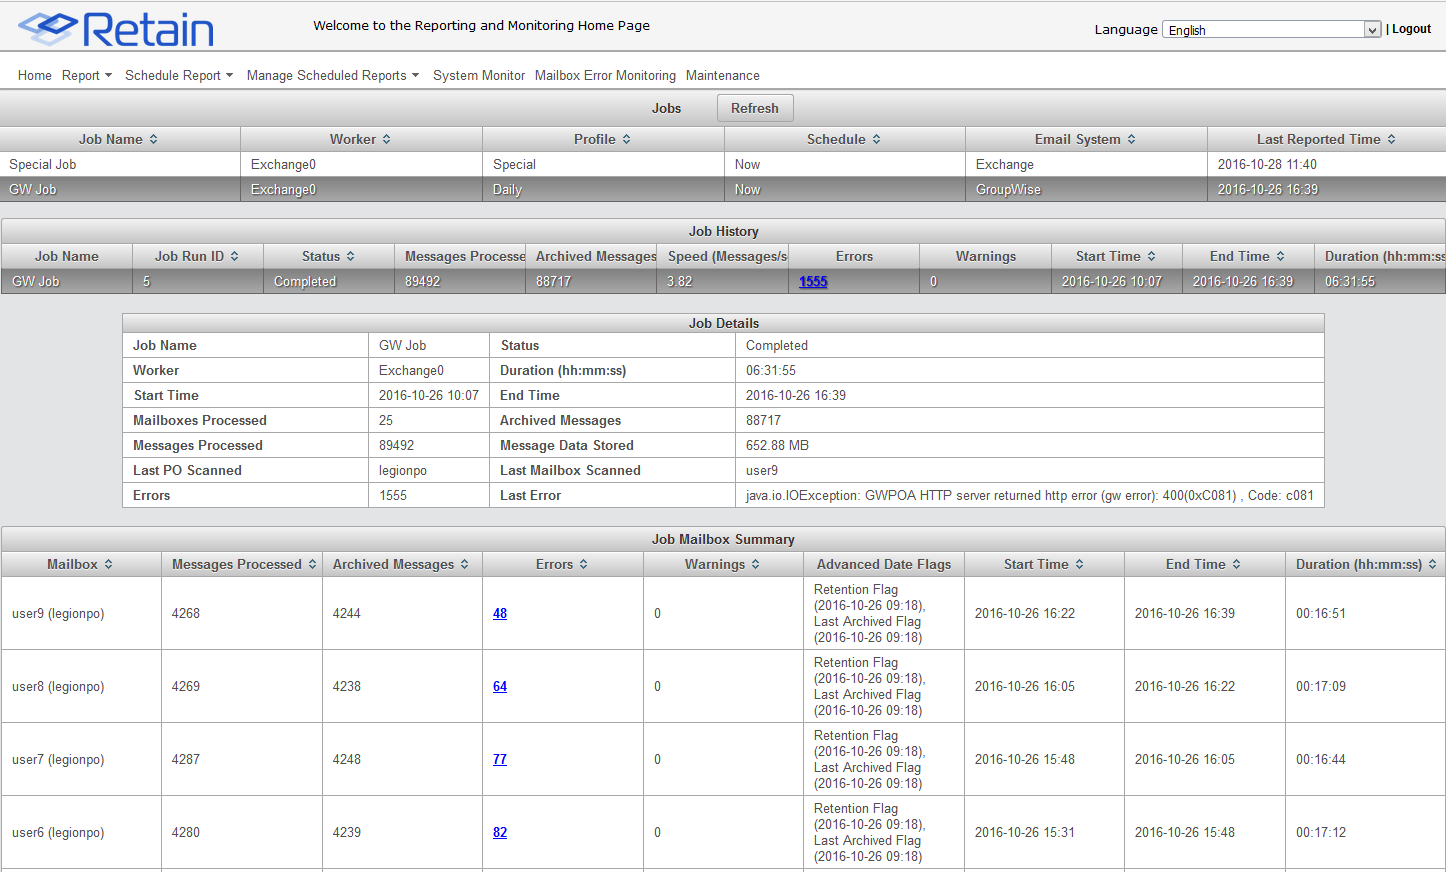
Further selection of a listed job instance will display details for that selected run of the selected job. If an error exists on any job, it will show up as a linked number under the error column. Errors reported here are linked to information on the error which has occurred.
A selected error will spawn a new window which displays the error and any applicable information, such as any associated files or error code numbers, a quick description (if a Retain error), the severity level, how often it has occurred, and in how many different mailboxes it has occurred.
The last error encountered in a job is also displayed in the Job details window. Select a column header to sort it as desired. The Errors column shown below has been sorted to show the highest number of errors first.
