7.3 Reporting and Monitoring
Retain comes equipped with a separate Reporting and monitoring server. Reporting and Monitoring may be installed on the same or a different physical or virtual machine as the Retain Server.
Reporting and Monitoring functions much like the Retain Worker in that it is installed as a separate entity and requires connection information from the Retain Server. Additional security is provided through the option to specify exactly which IP address(es) the Retain Server will allow a connection from. Separate with commas the IP addresses allowed if more than one. No mail data is transferred through this connection, only server statistic information.
7.3.1 Setup
The Core Settings, Logging, Connection and Notification sections of Reporting and Monitoring configuration work identically to the Worker connection settings, and should be filled-out accordingly. Most server implementations will require little to no modification to these settings save the notification tab.
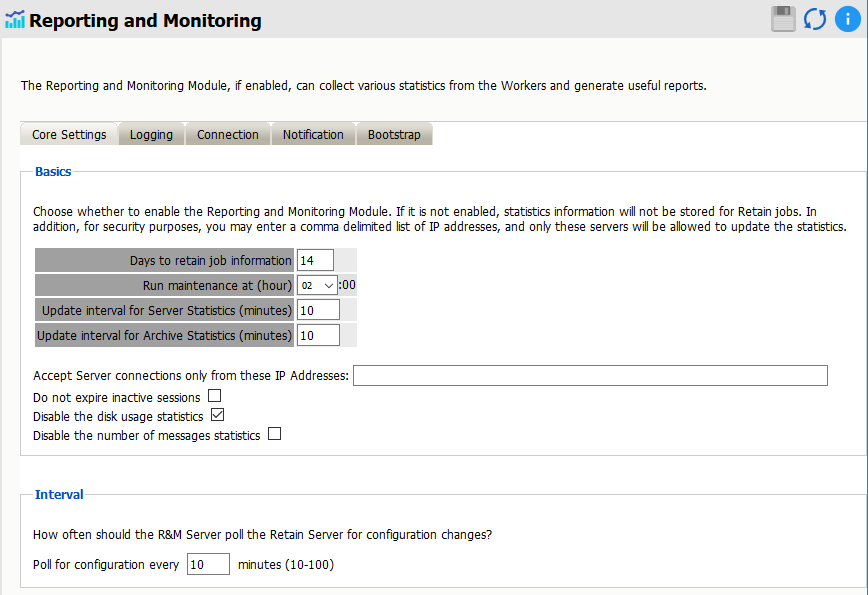
Core Settings
Days to retain job information: Default 14 days.
Run maintenance at (hour): Default 0200 or 2 AM.
Update interval for Server Statistics (minutes): Default 10 minutes. Specify the time interval that the server statistics (like CPU usage, disk storage, &etc) should be collected.
Update interval for Archive Statistics (minutes): Default 10 minutes. Specify the time interval that the archiving statistics (like number of messages archived, processed, errors, &etc) should be collected.
Accept Server connections only from these IP Addresses: Limiting the server connections to specified IP Addresses limits which machines have access to the Reporting and Monitoring module. Separate multiple addresses with a comma.
Do not expire inactive sessions: Putting a check-mark in the ‘Do not expire inactive sessions’ will allow sessions with the R&M module to never expire. This is useful in conjunction with the ‘monitoring’ page. Default disabled.
Disable the disk usage statistics: Selecting the ‘Disable the disk usage statistics’ box will disables the ‘archive size’ from server utilization report. Default enabled.
Disable the number of messages statistics: Selecting ‘Disable the number of messages statistics’ disables the ‘total messages stored’ on the Reporting and Monitoring dashboard. These options are for systems which encounter a bottle-neck which impacts system performance with these checks. Default disabled.
Interval: Poll for configuration every xx minutes. Default 10, limited from 10 to 100 minutes.
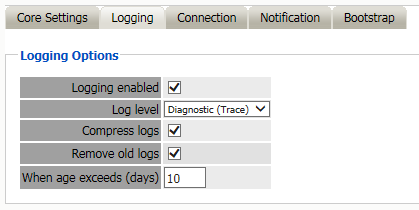
Logging
Set the logging level to the desired setting. Leaving the logging as default ‘normal’ is recommended unless instructed to increase the logging level by Support.
Connection
The Connection between Reporting and Monitoring, and the Retain Server should not be changed unless the Retain Server requires a modified connection path, (such as a custom port.)
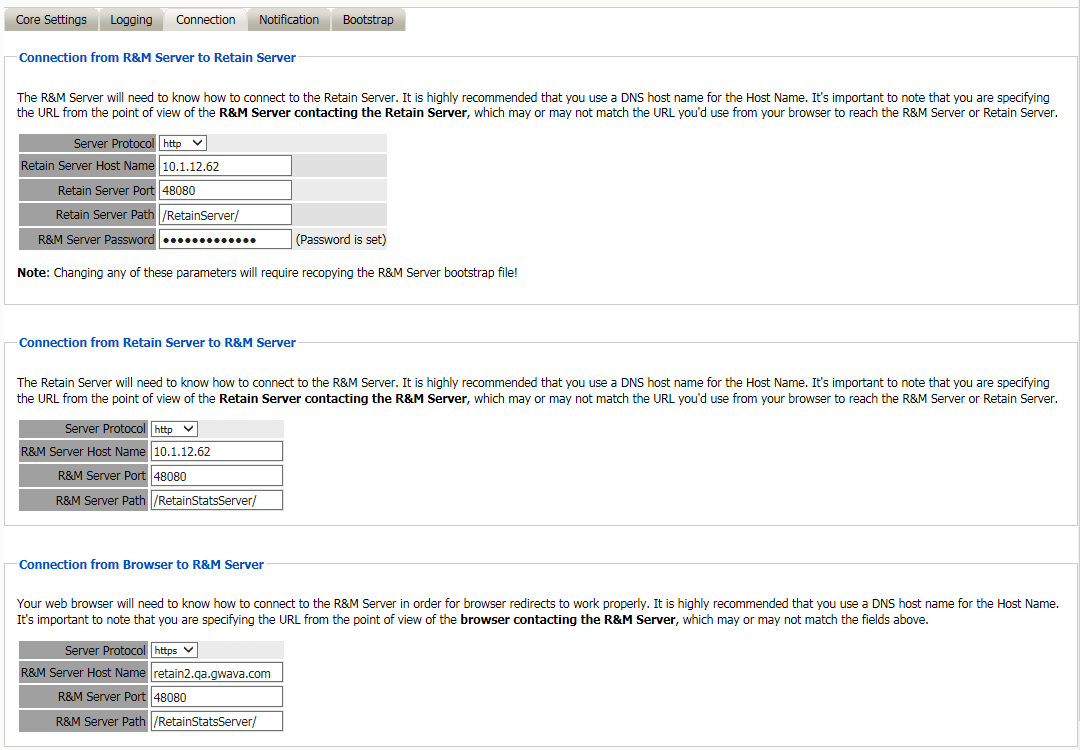
The R&M server is different from the Retain Worker in that the Retain Server is able to contact the R&M server as well. The connection address to R&M should not be modified unless custom connection settings have been created.
The connection from the Browser to the R&M Server is how the browser is going to connect to the R&M server when redirected from links in the Server. This connection information needs to be accurate for where the R&M Server is installed and listening.
When configured to use HTTPS, the web server must be configured to use a full TLS certificate chain signed by a trusted third party Certificate Authority, not self-signed, and configured with both server and intermediate certificates.
Notification
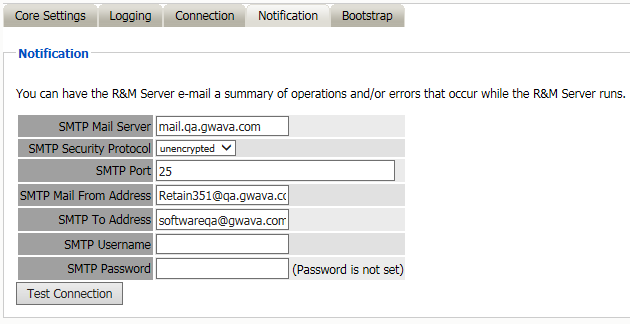
Notification defaults to the standard notification address specified in the Retain Server activation and initial configuration. If the notification is desired to be different, modify the settings here. Make sure to test the connection to ensure proper function.
Bootstrap
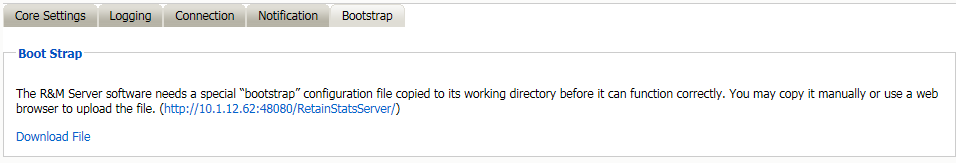
Like the Retain Worker, the R&M server must be uploaded a saved configuration or ‘bootstrap’ file. To access this tab, the configuration must be saved first. Then the bootstrap tab will become available. Download the file to a known location and then browse to the R&M server webpage. The default connection address is shown on the connection tab.
Uploading Bootstrap
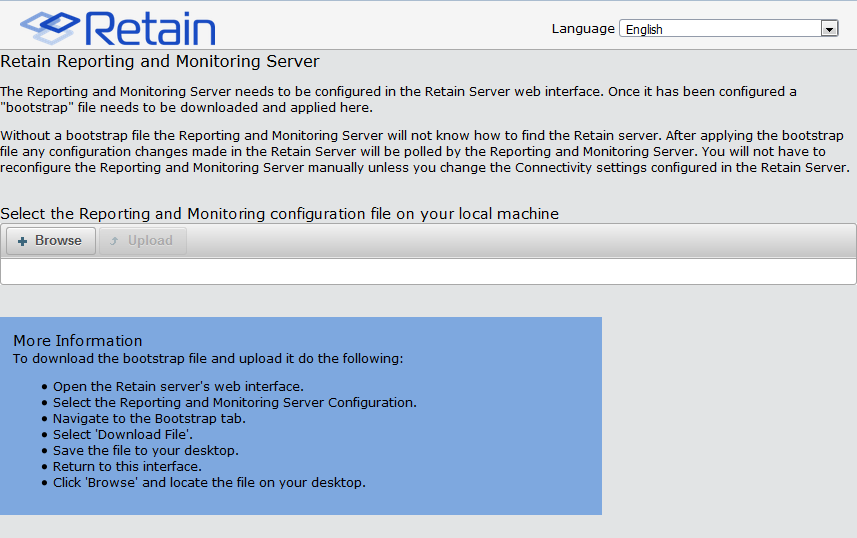
From the R&M initial webpage, click on the “Browse” button and browse to the saved bootstrap file and select it.
Click ‘Continue’ to upload the bootstrap file. As the bootstrap file is uploaded, R&M functions will become available. Only users with the administrative “Access Reporting and Monitoring Server” right will be able to login to the stat server.
To log into the R&M server, select the ‘Reporting’ or ‘Monitoring’ links from the Retain Server left menu to spawn a new tab or page to the R&M module.
7.3.2 Reporting and Monitoring Home Page
On login, Reporting and Monitoring opens to the Home page. The Home page is also accessible through the ‘Home’ button along the top bar. The R&M server has different page links and menus across the top of the menu bar, accessing different functionality. The R&M server has many tables and columns displaying a large amount of information. To make this information more accessible, every column has been made sortable. To sort the columns, simply click on them. They may be sorted to show the highest number first, lowest number first, or not sorted at all.
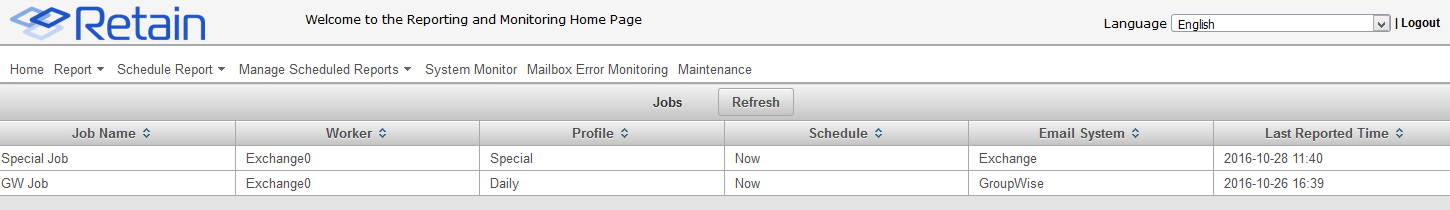
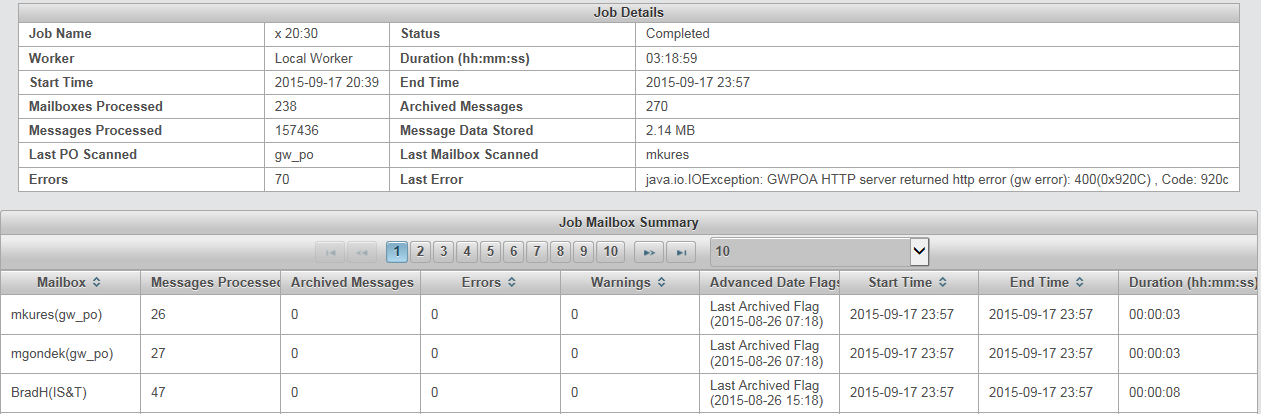
The Home page list the different jobs, associated workers, profiles, schedules, and last reported run times configured for the system. These jobs can be selected to display the job history and detailed information for each instance of when that job was run.
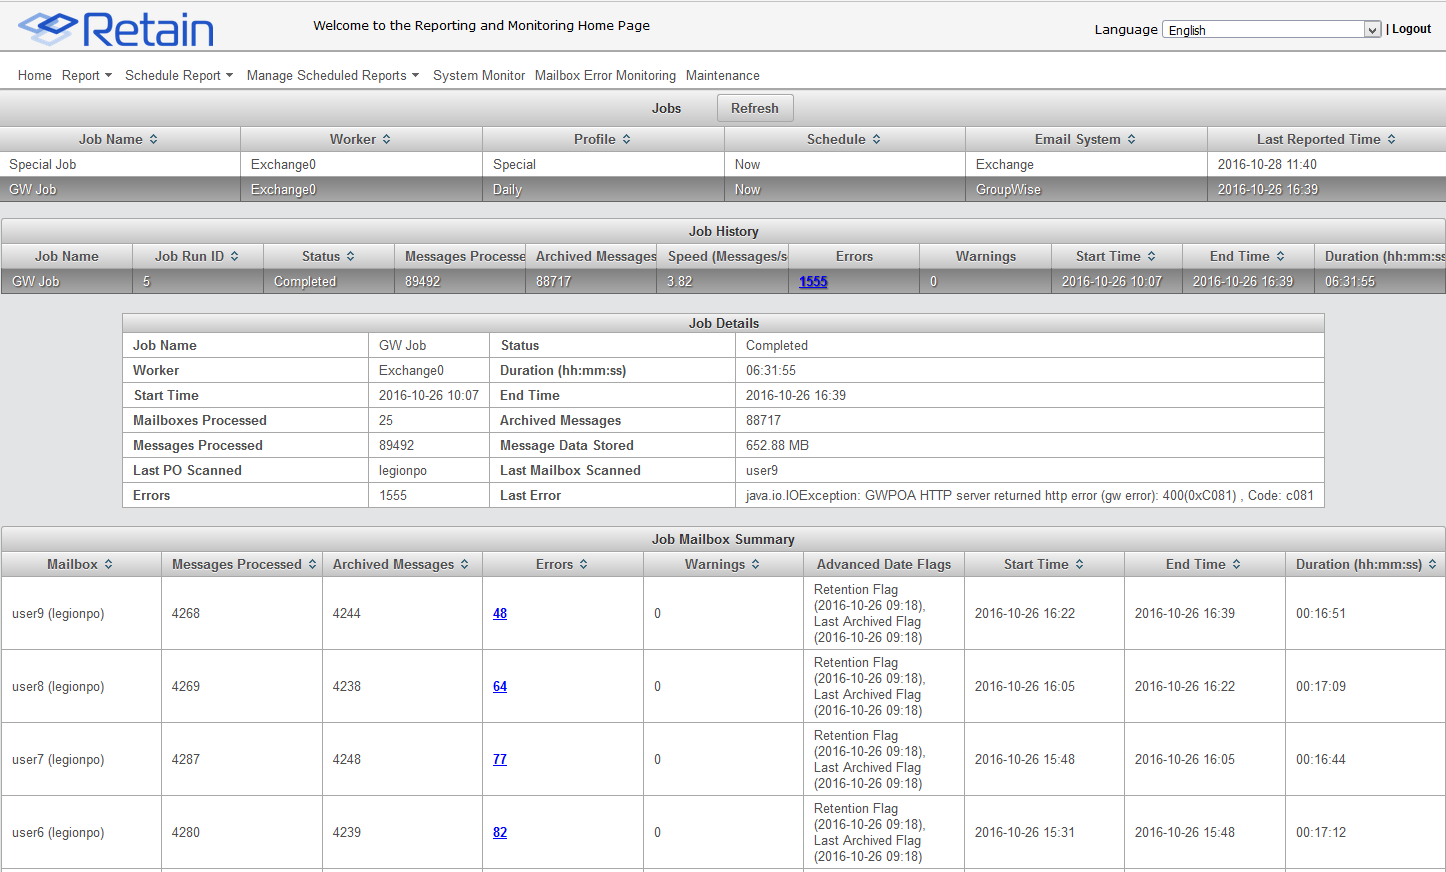
Further selection of a listed job instance will display details for that selected run of the selected job. If an error exists on any job, it will show up as a linked number under the error column. Errors reported here are linked to information on the error which has occurred.
A selected error will spawn a new window which displays the error and any applicable information, such as any associated files or error code numbers, a quick description (if a Retain error), the severity level, how often it has occurred, and in how many different mailboxes it has occurred.
The last error encountered in a job is also displayed in the Job details window. Select a column header to sort it as desired. The Errors column shown below has been sorted to show the highest number of errors first.