4.1 Viewing Patch Management Pages
A patch consists of a description, signatures, and fingerprints required to determine whether the patch is applied or not patched. A patch also consists of associated patch bundles for deploying the patch.
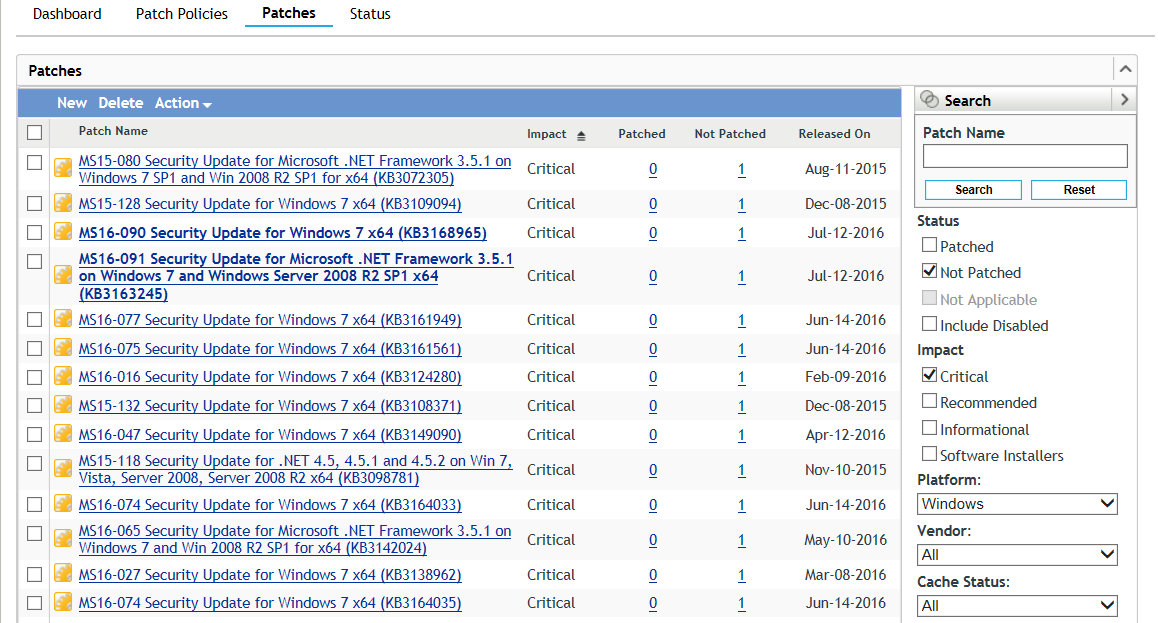
The Patches page displays a complete list of all known patches reported by various software vendors. After they are reported and analyzed, the patches are registered for distribution to your ZENworks Server through the ZENworks Patch Subscription Network. The ZENworks Agent should be installed on each device to check for known patches. A patch bundle called Vulnerability Detection is then assigned to run on each device on a daily basis to scan for known patches. This task returns the results that are displayed on the Patches page. The results are presented in a table of patch status. The total number of patches is displayed below the table in the bottom left corner.
NOTE:The Patches page downloads and displays patches only for the operating systems that are running on your managed devices. This process prevents wastage of bandwidth and disk space, which would be required to store thousands of unneeded patches in the ZENworks Primary Server database. If you connect a device running a previously undetected operating system, you must initiate replication again so that the Patch Management Server downloads patches for that operating system.
4.1.1 View the Patch Management Dashboard
The Dashboard page addresses operational, management, and compliance reporting needs.
NOTE:To use patch management effectively, you should disable patches that are irrelevant to your environment so that daily compliance statistics are based only on patches relevant to your network of devices, giving the percentage of enabled patches actually applied on a given day.
To view the Patch management Dashboard, navigate to Patch Management > Dashboard.
Subscription Service History. The Subscription Service History section displays the activity log of the subscription activities. The table below describes each item featured in this section:
|
Item |
Definition |
|---|---|
|
Type |
Subscription type defined for your account: Patches (Subscription Replication), Bundles (Subscription Replication), and Licenses. |
|
Status |
Status of the replication. When replication begins, the status reads In Progress. When replication ends, the status reads Complete. NOTE:If the replication process is interrupted, the status reads Resetting. This indicates that the replication process has continued from the point where it was interrupted. |
|
Start Date |
The date and time when replication started. |
|
End Date |
The date and time when replication ended. |
|
Duration |
The length of time the replication has been going on. |
|
Successful |
Indicates whether the replication was successful or not. True indicates successful replication and False indicates incomplete or failed replication. |
|
Error Detail (if any) |
Details of any error encountered during the patch download process. |
Recently Released Patches. The Recently Released Patches section lists the last patches that were downloaded by the subscription service. You can change how many patches display on each page by selecting the number of items in the bottom right-hand corner of the page.
|
Item |
Definition |
|---|---|
|
Patch Name |
The name of the patch. |
|
Platform |
The operating system that the patch applies to. |
|
Impact |
The impact of the patch in terms of its priority. |
|
Patched |
The number of devices that the patch has been installed on. |
|
Not Patched |
The number of devices that the patch has not been installed on. |
|
Released On |
The date that the patch was released. |
For information about the menu options in the Recently Released Patches section, refer to the menu items below:
-
New: Select this option to create a custom patch from an existing bundle. See Create a Custom Patch.
-
Delete: Select this option to remove patches from the Patch Management System. See Delete a Patch.
-
Action: Choose from four different actions to take on patches selected in Recently Released Patches: Deploy Remediation, Enable, Disable, and Update Cache.
See the first four Action options in the Execute Action Menu Options section.
-
Time: To define the age criteria (since vendor release) for patches displayed in Recently Released Patches, click the Time drop-down menu, and select Last 30 Days, Last 60 Days, or Last 90 Days.
Dashboard. The Dashboard panel consists of a graphical display and three standard reports that document patches, patch deployments, patch status, trends, inventory and more, at individual machine or aggregated levels. This provides a unified view to demonstrate progress toward internal and external audit and compliance requirements. Clicking a dashboard report will display more information about that report in tabular form.
The dashboard reporting thread captures daily statistics concerning the overall percentage of enabled patches that are actually patched on a given day. It will take at least 24 hours for the initial dashboard reports to be generated.
-
Patch Compliance: Displays the monthly [or daily] trend of overall compliance for each patch impact category.
Patch Management best practices recommend that an organization should monitor compliance reports over time to ensure that the intended patches are deployed regularly and the patch management solution is being used correctly. Detailed drill-down information showing the individual patched / not patched totals per patch can be seen in the Patch Management > Patches page.
-
Month [or Day]: Time period
-
Critical Patched: Percentage of Critical patches that are patched
-
Software Patched: Percentage of Software patches that are patched
-
Optional Patched: Percentage of Recommended and Informational patches that are patched
NOTE:For the Patch Compliance data to display, you need to have Save patch status history and one or more of the Impacts to include options selected in the Dashboard and Trending configuration.
Interactive options: Execute any of the following options to change how the data is displayed in the Patch Compliance panel:
-
Data or Graph: Click an option to display the data in a table format or a graph format.
-
Monthly or Daily: Select an option to display the data by month or by day in its current format, data or graph.
-
Critical Patched, Software Patched, and Optional Patched: Click a Patch Impact phrase or its associated symbol to hide that data on the graph. Click the phrase again to show the data.
-
Data point: Mouse over a data point on the graph to display more information in a tool tip.
-
-
Patch Compliance by Device: Displays the overall patch compliance of the devices that ZENworks Patch Management is monitoring.
Each device will only be evaluated as “compliant” if it has a patched status for all of the active patches currently available within Patch Management. It is recommended that patches that are not applicable should always be disabled within Patch Management so that this metric can track only the relevant patches for the managed network of devices.
-
Status: Compliant or Non-Compliant
-
Device Count: Total number of devices in each state
Interactive options: Execute any of the following options to change how the data is displayed in the Patch Compliance by Device panel:
-
Data or Graph: Click an option to display the data in a table format or a graph format.
-
Non Compliant, Compliant: Click either phrase or its associated symbol to hide that part of the pie chart. Click the phrase again to show that part of the chart.
-
Compliance tool tip: Mouse over a color on the chart to display a tool tip that shows the number of devices that are compliant or non compliant.
-
Device list: Click anywhere in a colored section of the pie chart to list all the devices for that section of the chart.
-
Device Name, UID: Click a device name or UID in the list to jump to the Summary page of that device.
-
-
-
Time Since Last Agent Refresh: Displays the elapsed time since the last refresh cycle for all managed devices within the network.
Within a patch management system, it is vital to ensure that all devices are scanned regularly for missing patches. Even with a regular daily refresh cycle, it is very likely that some laptops or workstations will be offline during any given day.
-
Elapsed Time: < 24 hrs, < 48 hrs, < 72 hrs, > 72 hrs, above custom time
-
Device Count: Total number of devices in each category
Interactive options: Execute any of the following options to change how the data is displayed in the Time Since Last Agent Refresh panel:
-
Data or Graph: Click an option to display the data in a table format or a graph format.
-
< 24 hrs, < 48 hrs, < 72 hrs, > 72 hrs: Click a time value or its associated symbol to hide that part of the pie chart. Click the phrase again to show that part of the chart.
-
Refresh tool tip: Mouse over a color on the chart to display a tool tip that shows the number of devices that were refreshed according to that time value.
-
Device list: Click anywhere in a colored section of the pie chart to list all the devices for that section of the chart.
-
Device Name, UID: Click a device name or UID in the list to jump to the Summary page of that device.
-
-
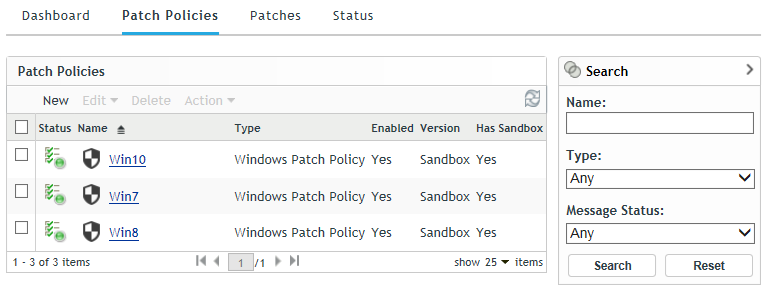
4.1.2 View Patch Policies
You create and manage patch policies from the Patch Management page, not in the Policies page.
To view patch policies, navigate to Patch Management > Patch Policies.
4.1.3 View Zone Patches
To view the patches that are discovered in the zone from the DAU tasks, click Patch Management in the navigation menu, and select the Patches page.
4.1.4 View Patch Status
The Status page displays the download status for patches and bundles in table form, and also displays the details of patch caching and queuing status.
To view the Status page, navigate to Patch Management > Status.
The page consists of two data tables, Status and Cache Status. Definitions for each table item are provided below:
Table 4-1 Status Item Definitions
|
Item Name |
Item Status |
|---|---|
|
Signature Download |
Indicates whether downloading of the signature has finished or is in progress. |
|
Signature Download Time |
Indicates the last time the local server contacted and downloaded the signature from the Patch Subscription server. |
|
Bundle Download |
Indicates whether the patch bundle download is finished or is in progress. |
|
Last Patch Download |
Indicates the last time the local server contacted and downloaded a patch from the Patch Subscription server. |
|
Number of Failed Download(s) |
Indicates the number of patches that failed to download from the Patch Subscription server. |
|
Number of Patches Queued for Caching |
Indicates the number of patches that are queued for download from the Patch Subscription server. |
|
Number of Active Patches |
Indicates the number of patches that are available for download from the Patch Subscription server. |
|
Number of New Patches (less than 30 days) |
Indicates the number of patches that have been uploaded to the Patch Subscription server in the last 30 days and are available for download. |
|
Latest Patch Released On |
Indicates the time when the latest patches were released. |
Table 4-2 Cache Status Item Definitions
|
Item |
Definition |
|---|---|
|
Action > Cancel Pending Downloads |
Cancels the download of any patches in the process of being cached. |
|
Name |
The name of a patch. |
|
Status |
Whether the patch has been successfully downloaded. |
|
Error Detail (if any) |
Details of any error that occurred during the download process. |