5.6 Generating Custom Reports
ZENworks Endpoint Security Management lets you create custom reports to better manage endpoint computers in your system.
The following sections contain more information:
5.6.1 Software Requirements
You can use ODBC-compliant reporting tools (for example, Crystal Reports*, Brio*, and Actuate*) to create custom reports not included in the Novell reports list. These reporting tools can view and query the reporting information from a common data warehouse, star format.
The reports included with ZENworks Endpoint Security Management were created using Crystal Reports for Visual Studio .NET (SP2). This version of Crystal Reports is bundled with Visual Studio .NET and is available as an optional component. To learn more, visit http://msdn.microsoft.com/vstudio/team/crystalreports/default.aspx.
5.6.2 Creating a ZENworks Endpoint Security Management Compliant Report
Before you begin, please review the report creation process outlined at: http://msdn.microsoft.com/vstudio/team/crystalreports/gettingstarted/default.aspx.
The first phase implementation of the ZENworks Endpoint Security Management reporting framework has the following requirements of every report to be integrated into the system:
-
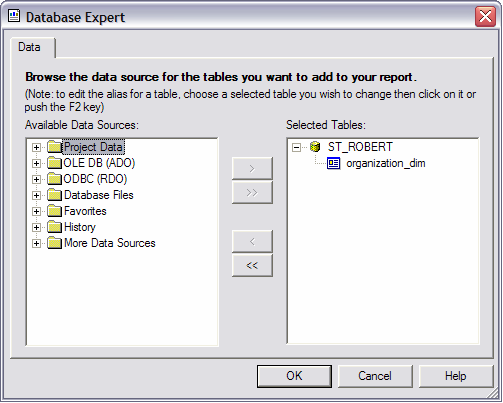
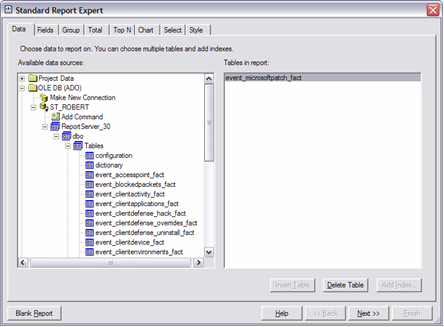
The report must be based on only one data source. That data source must be a single table or view residing within the source database.
Figure 5-13 Browse the Reporting Data Source
-
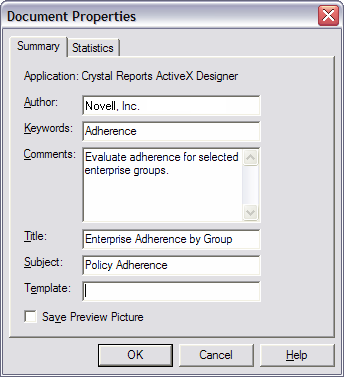
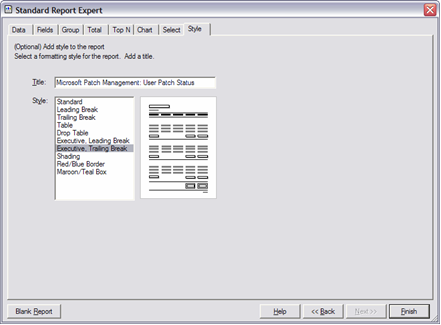
The report must have a title specified and saved with the report. The optional title, subject, author, and comments display if specified.
Figure 5-14 Report Document Properties
-
The report cannot contain any sub-reports.
-
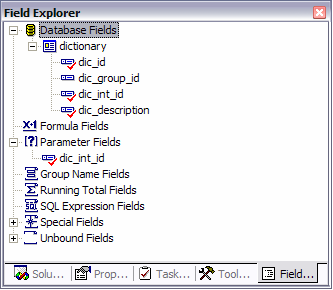
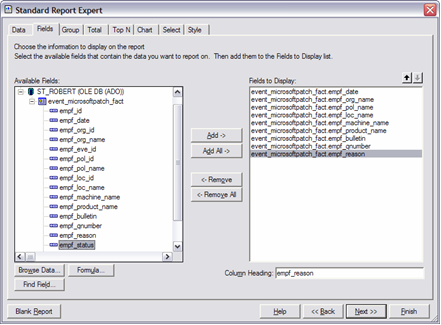
Filtering parameters must be named the same as the target columns within the database fields of the table or view.
Figure 5-15 Available Database Fields
5.6.3 Available Reporting Information
The ZENworks Endpoint Security Management reporting database is designed to closely model the star schema format. The star schema is a single "fact" table containing a compound primary key, with one segment for each dimension and additional columns of additive, numeric facts.
The Reporting Service includes the following two dimension tables:
ORGANIZATION_DIM: The organization table, defining the instances of users, groups, organizational units, containers, and services in a hierarchal relationship. Each row represents one of these units.
UNIT_MEMBER_DIM: Association of organization units to other organization units. For example, although a user can be stored within a specific container within Active Directory, the user might also be a member of an organization unit or security groups. Each row represents a relationship of organization units.
The data source must be defined to the reporting tool, typically for most third-party applications the following steps are necessary:
-
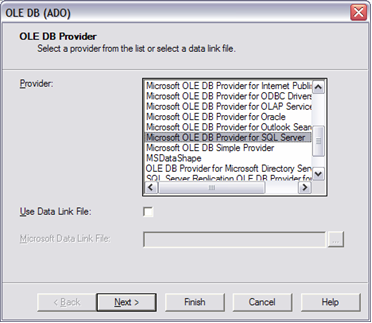
Define an OLEDB ADO connection to the server hosting the Management Service.
-
Select the Microsoft OLE DB Provider for SQL Server.
-
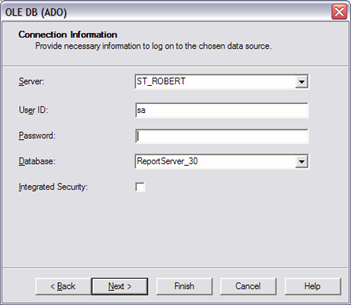
Enter the Management Service server as the server.
-
Enter the SQL account name and password.
-
Enter the Reporting Service database name (default name is STRSDB) as the database.
The following views are available for report generation:
-
EVENT_ACCESSPOINT_FACT_VW: This view describes the access points observed by user, day, policy, location, and access point instance.
-
EVENT_BLOCKEDPACKETS_FACT_VW: This view describes the summarized instances of port activity that was blocked due to policy configuration by the endpoint. The information included is logged user, day, policy, location, and source/destination IP/port.
-
EVENT_CLIENTACTIVITY_FACT_VW: This view describes the summarized instances of port activity at the endpoint. The information included is logged user, day, policy, location and device.
-
EVENT_CLIENTAPPLICATIONS_FACT_VW: This view describes the summarized instances of application use (duration) by user, day, policy, location and application.
-
EVENT_CLIENTDEFENSE_HACK_FACT_VW: This view describes the instances of hack attempts against the endpoint client. Active users, applications, and services are included within the report. The data is grouped by user, day, policy, location, and attack result.
-
EVENT_CLIENTDEFENSE_OVERRIDES_FACT_VW: This view describes the instances of policy override and the affected devices. The data is grouped by user, day, policy, location, and override type.
-
EVENT_CLIENTDEFENSE_UNINSTALL_FACT_VW: This view describes the instances of attempts to remove the endpoint client. The data is grouped by user, day, policy, location, and attack result.
-
EVENT_CLIENTDEVICE_FACT_VW: This view describes the types of devices in use by an endpoint. The data is grouped by user, day, policy, location, and device type.
-
EVENT_CLIENTENVIRONMENTS_FACT_VW: This view describes the custom (stamped) network environments used for location detection. The data is grouped by user, day, policy, location, device type, and environment data.
-
EVENT_CLIENTINTEGRITY_FACT_VW: This view describes the results of integrity rules applied at the endpoint. The data is grouped by user, day, policy, location, and rule.
-
EVENT_CLIENTLOCATION_FACT_VW: This view describes the time at location as well as adapter (configuration and type) used at the location. The data is grouped by user, day, policy, and location.
-
EVENT_CLIENTRULE_FACT_VW: This view describes the generic reporting mechanism for integrity and scripting rules. The data is grouped by user, day, policy, location, and rule.
-
EVENT_COMPONENTACTION_FACT_VW: This view describes the Management Console activity performed on specific components. For example, you could see when the policy update interval was changed for a specific location in a policy. The data is grouped by user, day, policy, and component and defines the new and old value.
-
EVENT_MANGERIO_FACT_VW: This view describes when a component has been created or edited. The data is grouped by user, day, component, and action.
-
EVENT_ORGANIZATIONACTION_FACT_VW: This view describes the user activity as it relates to ZENworks Endpoint Security Management integration with an Enterprise information repository. All user management activities are reflected within this table.
-
EVENT_POLICYCOMPONENT_FACT_VW: This view describes the interaction of components and policies. For example, when a location is added to a policy, an audit row reflects that change. The data is grouped by user, day, policy, component, and action.
-
EVENT_PUBLISHACTION_FACT_VW: This view describes the policy and component assignment to an organization.
-
EVENT_SERVERACTION_FACT_VW: This view describes the user activity with the Distribution Service (Check In, for example).
-
EVENT_USERACTION_FACT_VW: This view describes the user policy activity with the Distribution Service (Policy, Key, EFS Key, Schema downloads).
5.6.4 Creating a Report
The following steps describe the creation of a simple report. The following example uses the Visual Studio.NET 2003 Enterprise Architect IDE.
-
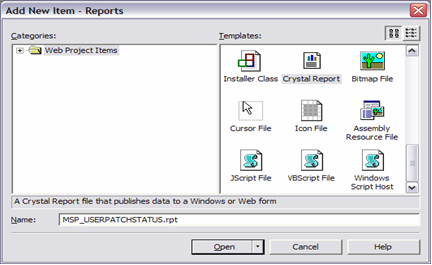
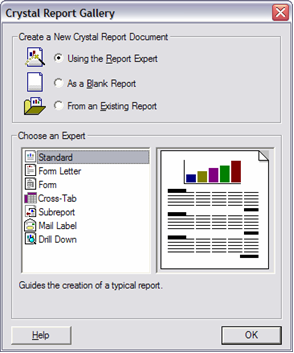
From the IDE, select and add a new Crystal Report.
-
Create a report using the wizard.
-
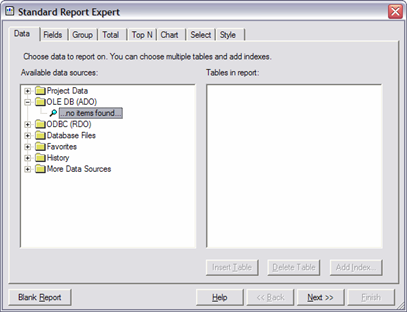
Define the data source. Access the Management Service reporting service database within data.
-
Using the connection definition wizard, define an OLEDB ADO connection to the Reporting Service database. Select , then click .
-
Select the Reporting server. Enter the User ID, password, and database name for the Reporting Service (see the ZENworks Endpoint Security Management Installation Guide for more information). Click then click .
-
Select the desired source table or view for your report by expanding the tree nodes as shown below.
-
Under the tab, select the table or view columns that you want to include within your report. Click to continue.
-
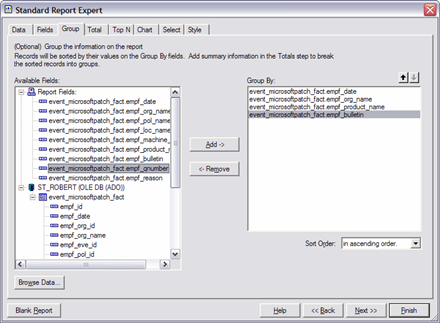
If you are planning to group or summarize your data, click the tab and select the columns you want to group. Click or select the tab.
-
Title the report and select the style.
The Report Builder displays.
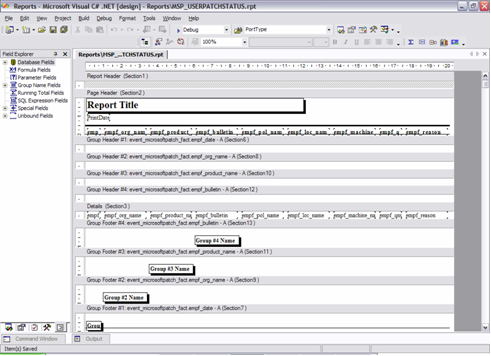
-
To set up a filter, right-click in the field explorer, then click .
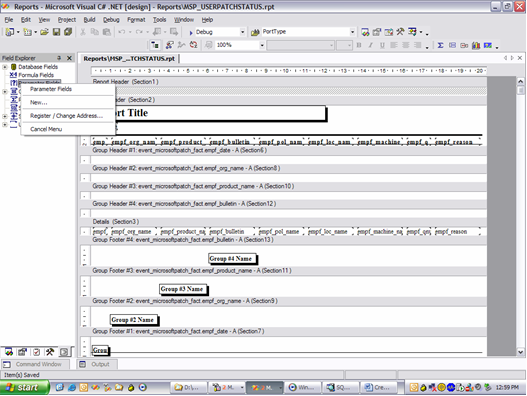
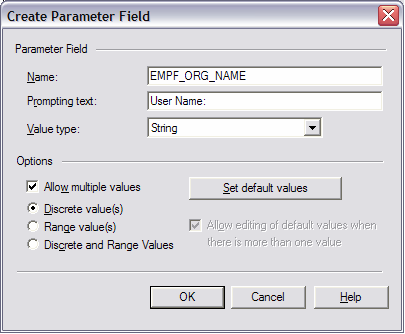
-
The following filter allows you to select multiple users to filter by with the prompting text of "User Name:" displayed within the UI. The parameter is named the same as the column.
-
Right-click the report, then click .
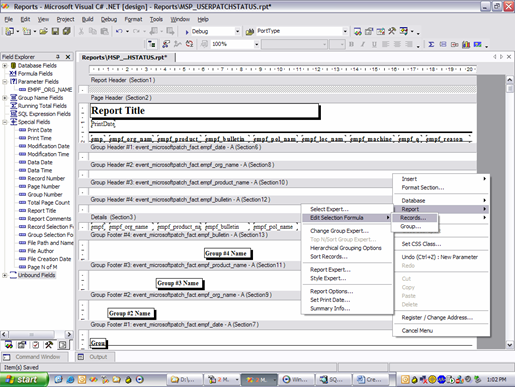
-
Using the new parameter, specify only the records where the field equals the values selected in the parameter. Select the column and then a comparison (=) and then the parameter. Press CTRL-S to save the filter
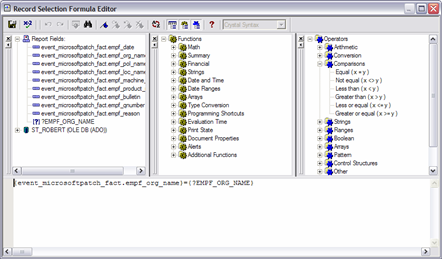
-
Repeat Step 10 to Step 13 for each filter. Edit the design of the report and the save the report.
-
After a custom report is generated, the report can be dropped into the \Program Files\Novell\Management Service\Reports\Reports\ directory on the Management Service Server. Once there, the new report displays in the reports list in the Reporting Service web interface (click to display the new reports).