3.8 Analyzing Data
After creating a data set instance, Analyzer lets you configure and perform analyses on those data set instances. Analyzer’s data analysis refines and extends the data inspection capabilities available in the Data Browser.
Analyzing a data set involves two tasks:
3.8.1 Creating and Customizing an Analysis Profile
An analysis profile stores the details of the data analysis you want to perform. You can also create custom analysis metrics.
Creating an Analysis Profile
-
In the Project View, right-click the Analysis Profiles object, then select .
-
In the Name the Analysis Profile dialog box, specify a name for the analysis profile, then click .
Analyzer creates a new Analysis Profile object in the selected project, and opens the Analysis Profile editor, from which you can finish configuring the analysis profile.
-
In the Analysis Profile editor, click
 to open the Analysis Metric Selector and configure an attribute-based analysis.
-
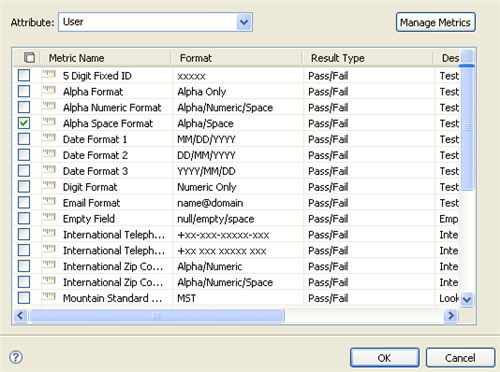
In the drop-down list, select the attribute to test.
-
Select the test metrics to use with this attribute, then click .
You can select from Analyzer’s predefined metrics, or create a new metric. For more information, see Creating a New Test Metric.
-
-
(Optional) Repeat Step 3 above to configure additional attribute tests for the analysis profile.
-
Click
 in the toolbar, or click Ctrl+S to save the analysis profile.
Creating a New Test Metric
Analyzer uses a set of predefined metrics, or you can create custom test metrics for use in data set analysis.
To create a new test metric:
-
In the Analysis Profile editor, click
.
-
In the Analysis Metric Selector, click .
-
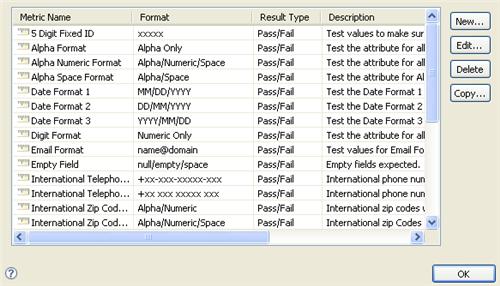
In the Metric Manager, click .
The Metric Manager provides three other icons for managing Analyzer’s metric list:
Edit: Opens a dialog box from which you can edit the selected metric. You cannot edit predefined metrics.
Delete: Deletes the selected metric. You cannot delete predefined metrics.
Copy: Creates a custom metric based upon the currently selected metric. This is particularly useful for creating custom metrics based on predefined metrics.
-
In the New Metric dialog box, provide the requested information, then click .
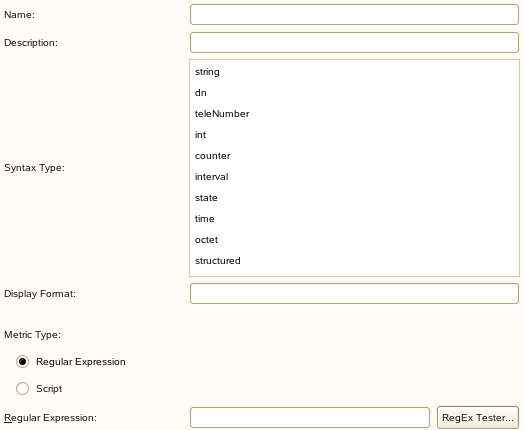
Name: Specify a name for the test metric.
Description: Specify a longer text description for the test metric.
Syntax Type: Specify the data types (you can select more than one) for which Analyzer preselects this metric. For example, a String metric might automatically be associated with attributes of type String in the Analysis Profile editor.
Display Format: Describe the metric’s regular expression in a human-readable format. This is informational only. For example, a telephone number metric might indicate its Display Format as (xxx) xxx-xxxx.
Metric Type: There are two different metric types: Regular Expressions and Script. Data tests can be performed with regular expressions or by using scripts. Select the desired type of metric and use the provided field to enter the regular expression or script.
-
Regular Expression: Analyzer utilizes regular expression (regex) syntax to define metrics. You can view the regex syntax for a predefined metric by selecting it in Manage Metrics, then clicking .
NOTE:Regex is a complex language with unique syntax and rules. Make sure you are familiar with regex concepts and standards before trying to modify or create a metric. Analyzer metrics utilize regex as defined in the Java Platform Standard Edition 6.
For information about using regex with Unicode characters, see Using Regex with Unicode Characters.
-
Scripts: Analyzer currently supports ECMAScript (the generic classification for JavaScript), Python, and Ruby. For more information, see :
-
The following sections explain how implement the script metric.
Creating an Script Metric
The same script can be used to test and clean data. It can be applied as a test script or applied as a cleaning script. For more information about cleaning data, see Section 3.9, Cleaning Data.
-
Select as the metric type.
-
Select the type of script:
-
-
Create the script in the space provided, then click .

Copying and Modifying a Script
An easy way to create a new script is to copy an existing script, changing the , , and fields as needed, then editing the script itself. A predefined script metric named Data Range can be used for this purpose. One advantage of this approach is that the predefined script contains comments describing how to access attributes within the script and how to return Pass/Fail status or cleaned values.
Using the JavaScript Editor to Modify a Script
An alternate way to modify a script is to use Eclipse's built-in JavaScript* editor, which provides a full-screen color-coded view.
-
From the Analyzer toolbar select > > .
-
In the Navigator view, select > > > > .

-
Right-click the .js file, then select >
-
Edit the script, then click .
-
Switch to the Data Browser view.
-
Right-click a cell in the desired column, then select .
-
Select the script file to run against the data.
Accessing Attributes within a Script
When you run a script, the value to be tested is sent into the script as the script variable aimvalue. The script should set the Boolean variable aimReturnStatus to True or False before returning. True indicates the value passed the test, and False indicates failure. For example, a very simple script to test that values don't exceed 64 characters might look like this:
 aimReturnStatus = true;
   aimReturnValue = aimValue;

   if (aimValue != null && aimValue.length > 64)
      aimReturnStatus = false;
For an empty cell, for example an unpopulated value, aimVaule contains null, so the script needs to handle this.
If the script needs to access other attributes in the record in order to test the value in question, it can use script variables:
   aimValue             - the current value being tested
   aimArrayValue        - array of all values in the current cell
   aim_<attrName>       - the value of each attribute in the dataset
   aimArray_<attrName>  - array of values for each attribute

   aimReturnStatus      - boolean variable.  Set to true if value passed test, false if failed.
   aimReturnValue       - Used for data cleaning. Return with original value to leave unmodified.
For example, if there is a Country attribute in the dataset, it can be accessed in the script as the variable aim_Country. If the attribute is empty, aim_Country contains null. If this attribute has multiple values, aim_Country contains the first value.
If the script needs to look at all values of a multi-valued attribute, it can use the aimArrayValue for an array of values in the current cell, or aimArray_<attrName>for an array of all the values of any attribute in the dataset. If a cell is empty the array variable is a 0-length array.
In this example, the metric returns a failure for each value of an attribute with more than one value.
   aimReturnValue = aimValue;
   aimReturnStatus = aimArrayValue.length > 1;
Using Regex with Unicode Characters
Click to open a dialog box from which you can compile and test the regular expression before saving the new metric.
You can generalize any regex expression to work properly with Unicode characters. You can refer to Unicode characters in three different ways:
Character Code
Each Unicode character has a unique code, which takes the form \u####. For example:
-
\u0061 = a
-
\u0374-\u03F3 = Greek character set
Character Category
Each Unicode character is assigned to a character category, and potentially subcategory. This lets you easily refer to specific types of characters as a group. Character categories include Letters, Numbers, Punctuation, Symbols, Marks, Separators, and Other.
Some examples of using Unicode categories in regex include the following:
|
Regex |
Description |
|---|---|
|
[A-Za-z] or \p{Alpha} |
ASCII characters from the Letters category. |
|
/p{L} |
A character from the Letters category, regardless of language. |
|
/p{Lu} |
A character from the Uppercase subcategory of the Letters category, regardless of language. |
|
\p{Ll} |
A character from the Lowercase subcategory of the Letters category, regardless of language. IMPORTANT:Some letters are neither uppercase or lowercase, such as CJK Ideographs (Asian characters). |
|
[0-9] or \d |
ASCII digits 0 - 9. |
|
\p{Nd} |
A character from the Digits subcategory of the Numbers category, regardless of language. This includes Asian full-width digits. |
|
\p{punct} |
ASCII characters from the Punctuation category, which includes the following characters: !”#$%&'()*+,-./:;<=>?@[\]^_`{|}~. |
|
\p{P} |
Any character from the Punctuation category, regardless of language. |
|
<space> |
A space character. |
|
\s or \p{Space} |
Any whitespace character, which includes the following: <space> \t \n \x0B \f \r. |
|
\p{S} |
Any character from the Symbol category, regardless of language. |
|
\p{Sc} |
A character from the Currency subcategory of the Symbols category, regardless of language. |
|
[^A-Za-z] |
Any character that is not an ASCII letter. |
|
\P{L} |
Any character that is not in the Letters category, regardless of language. |
NOTE:For more information on Regular Expression Categories and Subcategories, see Unicode Technical Standard #18.
Character Blocks
Each Unicode character is part of a block, or character set. You can refer to entire blocks of Unicode characters by specifying the block name proceeded by “In.” For example:
|
Regex |
Description |
|---|---|
|
\p{InGreek} |
Any character in the Greek block. |
|
^[\p{InBasic Latin}\p{InLatin-1 Supplement}]+$ |
Only characters in the Basic or Latin-1 blocks. |
|
^[[\p{L}\d\s]&&[\p{InBasic Latin}\p{InLatin-1 Supplement}]]+$ |
Only characters in the Basic or Latin-1 blocks of type Letter, Digit, or Whitespace. |
A list of Unicode Block Names is available on the Web.
3.8.2 Analyzing a Data Set
After creating and configuring an analysis profile, you can use the profile to analyze selected data set instances. You can use the analysis profile to analyze several different aspects of an application’s data at once to determine how closely the data follows your defined rules for format and content.
IMPORTANT:You should make sure the connection’s schema map is correct before attempting an analysis. If none of the tested attributes are mapped, the analysis does not run. If some of the attributes are mapped, the analysis runs but you get only partial results.
To analyze a data set:
-
In the Project View, browse to the analysis profile you want to run.
-
Right-click the Analysis Profile object, then select .
Alternatively, you can click the icon
 in the Analysis Profile editor for the appropriate analysis profile.
-
In the Analyze Data Sets dialog box, select the data set instances against which you want to run the analysis.
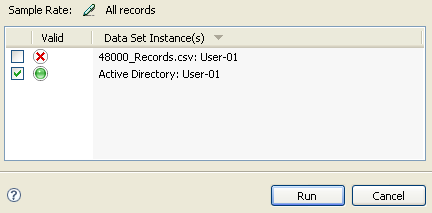
When you select a data set instance, Analyzer reviews the analysis attributes to make sure they are properly mapped to the Application schema, and that they exist and are valid in the selected data set definition.
If all checks return successfully, Analyzer displays a green icon next to that data set definition.
If any check returns with one or more issues, Analyzer displays a yellow or red icon next to that data set definition. Click the icon for more information about the issues Analyzer has encountered.
-
(Optional) Click the icon
 to specify a sample rate for the analysis profile.
This opens the Sample Rate Selector dialog box, from which you can select one of four sampling options:
All Records: (Default) Analyzer analyzes all records in the data set.
Number: Analyzer analyzes the specifies number of records, starting at the beginning of the data set.
Time: Analyzer analyzes data set records for the specified number of minutes. This might be useful with very large data sets and large or complex analysis profiles.
Sample every nth record: Analyzer analyzes every nth record in the data set. For example, specifying a value of 3 instructs Analyzer to analyze every third record.
NOTE:The following metrics bypass the sample rate setting, and always query all records: Populated Field, Pattern Frequency, Empty Field, and Unique Values.
-
In the Analysis Results view, select an individual attribute to see both graphical and detailed results of the analysis for that attribute.