3.2 Monitoring the Sync Engine
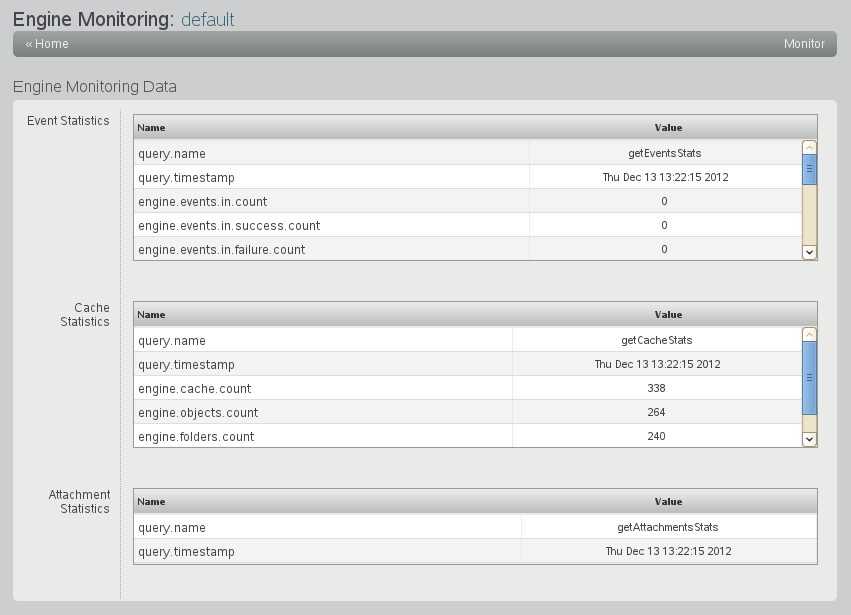
You can assess the functioning of the Sync Engine by checking statistics for events, caching, and attachments.
-
In Synchronizer Web Admin, click
 in the column for the Sync Engine (default) to display the Engine Monitoring Data page.

-
Review the monitoring data in the section.
Events are actions that users take on items that are being synchronized. A single item can have multiple events associated with it.
Statistic
Description
query.name
The name of the Sync Engine query that is returning the statistics (getEventsStats).
query.timestamp
The date and time when the statistics were gathered. Refresh your browser window to refresh the statistics.
engine.events.in.count
The number of events that the Sync Engine has received from connectors.
engine.events.in.success.count
The number of events that the Sync Engine has received and has successfully stored in its cache for transfer to connectors.
engine.events.in.failure.count
The number of events that the Sync Engine has received but has not stored in its cache. Events are not stored when there is an error associated with the event, so that it cannot be successfully processed, or because the event is associated with a user that has not yet been added to any connectors.
engine.events.in.status.count
The total number of status events that the Sync Engine has received from connectors. Status events inform the Sync Engine whether an event was received, dropped, or ignored by a connector.
A connector drops an event when the event does not fit within the active policies of the connector. For example, the connector drops events that do not pertain to any users that have been added to the connector.
A connector ignores an event when the event cannot be acted on. For example, if the connector receives a delete event for an item that is no longer available for deletion, it drops the event.
events.in.status.success.count
The number of status events received by the Sync Engine that indicate that the events were successfully processed by a connector, so that the Sync Engine does not need to resend those events.
engine.events.in.dq.count
The number of direct queries received by the Sync Engine. A direct query occurs when Synchronizer Web Admin communicates directly with a connected application.
engine.events.out.count
The total number of events that the Sync Engine has sent out to connectors.
engine.events.out.success.count
The number of events that the Sync Engine sent successfully to connectors.
engine.events.out.dq.count
The number of direct queries sent out to connectors.
-
Review the monitoring data in the section.
The Sync Engine caches events until they have been successfully synchronized to all connectors that need the events.
Statistic
Description
query.name
The name of the Sync Engine query that is returning the statistics (getCacheStats).
query.timestamp
The date and time when the statistics were gathered. Refresh your browser window to refresh the statistics.
engine.cache.count
The number of events that are currently cached in the database awaiting synchronization.
engine.objects.count
The number of objects associated with the cached events.
engine.folders.count
The number of folders where synchronized items are stored.
engine.cache.pending.count
The number of events that are waiting in the pending queue because one or more events on which they are depending have not yet been received. For example, if the event for adding an item arrives before the event for adding the folder in which the item must be stored, adding the item must wait until the folder has been added.
-
Review the monitoring data in the section.
Many different types of files can be attached to items. Some types and sizes of attachments are synchronized between applications and some are not, depending on how each connector is configured.
Statistic
Description
query.name
The name of the Sync Engine query that is returning the statistics (getAttachmentsStats).
query.timestamp
The date and time when the statistics were gathered. Refresh your browser window to refresh the statistics.
engine.attachments.count
The number of logical associations between attachments and events that are stored in the cache.
engine.filestore.count
The number of physical attachment files that are stored in the cache. The number of physical attachment files can be less than the number of logical attachments, because a single physical attachment file can be associated with multiple events.
-
When you are finished viewing the engine monitoring data, click in the menu bar to return to the main Synchronizer Web Admin page.