1.8 Testing and Debugging the Application
If you are new to NetWare and NLM development, the following sections provide a few tips on how to test and debug an NLM:
Both Metrowerks CodeWarrior and NetWare have debuggers. The NetWare debugger is internal, but is also available as a virtual debugger for analyzing a server abend. The Metrowerks debugger is a client/server debugger. For more information, see the following:
-
For a brief introduction to the NetWare internal debugger, see Using the NetWare Debugger after an Abend.
-
For information on the CodeWarrior debugger, see the debugger section in Targeting the NetWare Operating System.
1.8.1 Testing in Protected Address Space
Starting with NetWare 5, an NLM can run in a protected environment, which is separate from the kernel (also called the operating system memory space or ring 0). This protected address space isolates the memory errors of the NLM from the operating system and from other running applications. For more information, see the following:
The LibC family of libraries loads into protected address space as well as into the kernel. Thus, there are two copies running—one in the operating system address space and another in the protected address space. All protected address spaces have access to the same copy of LibC through protected address space mappings.
NLM applications can also be loaded into one or more protected address spaces, but they must be loaded explicitly.
Some NLM applications cannot run in protected address space, for example, LAN or disk drivers. However, most applications can run in protected address space, and you might want to load your application (which can be a series of NLM applications) into protected address space during part of your testing phase. Because system administrators can select to load your application into protected address space, you should test it in that space and ensure that it works.
Although all applications run slower in protected address space, some more than others, testing an application in protected address space has the following advantages:
-
Addressed memory is verified for validity and length. For example, if an input parameter points to an array of structures, the interface verifies that the starting address is valid and that enough memory is allocated for the array.
-
Values passed are verified for validity. For example, if a function needs to write the contents of a buffer to a screen, the interface verifies that the specified screen is on the list of valid screens and that the calling NLM application has access to that screen.
-
Values resulting from operations are verified for validity. For example, if a process were to attempt to divide by zero, the parameter value would be declared invalid.
If an invalid value is passed, the default behavior is to unload the passing NLM without terminating normally, to delete its associated protected address space, and to release the memory that the address space occupied. A number of SET parameters control how the operating system handles an NLM in protected address space. In particular, see the “memory protection fault cleanup” and the “memory protection no restart interval” options in the Memory category and the “auto restart after abend” option in the Error Handling category.
1.8.2 Test Tools for the YES, CERTIFIED Program
Novell has a group of system test tools that you can use to test your application and that can qualify your application for a YES, CERTIFIED logo. See the following links for more information:
1.8.3 Using NCF Options
When you are testing your application, you should add the following lines to the end of your test server's autoexec or startup ncf file.
  set developer option = on
  set auto restart after abend = 0
  set memory protection fault cleanup = off
The following table explains these parameters
Table 1-5 NCF Options
|
Parameter |
Description |
|---|---|
|
developer option |
Ensures that NetWare operating system sends messages about any errors that it encouters with your application to the system logger screen (NetWare 6.0 and above) or the system console screen (NetWare 5.x ). At unload time in particular, it sends out warnings about any memory that your application failed to release. You can set this option in the autoexec.ncf file. |
|
auto restart after abend |
Ensures that if your application abends your test server, the server doesn't automatically restart itself. The server stays in its suspended state so you can examine it. For information on using the NetWare debugger, see Using the NetWare Debugger after an Abend. You can set this option in the startup.ncf file. |
|
memory protection fault cleanup |
Enables the server to clean up a protected address space that has faulted. If this parameter is off and a protected address space faults, the server does not remove the address space or return resources to the system. The situation is left to the abend recovery mechanism. You can set this parameter in the startup.ncf file. |
For more information about SET parameters, see the Utilities Reference in a NetWare manual set.
1.8.4 Using syslogd Daemon
The syslogd daemon is a standard logging device used by UNIX*, Linux*, and open source code. The advantage of using it over the NetWare logger screen is that your code is then portable to other systems. The syslogd daemon is an NLM, which runs only in the kernel. It cannot be loaded into protected address space. It can be loaded manually, or you can call openlog (defined in syslog.h), and LibC will load it if it has not already been loaded.
NOTE:The syslogd.nlm is not related to syslog.nlm, which is the logging NLM for NSS. These two NLMs know nothing about each other and do not inter-cooperate in any way.
When you install the LibC SDK, the syslogd daemon is installed by default in the c:\novell\ndk\libc\lib directory. To try it out on a NetWare test server, install syslogd.nlm in the c:\nwserver directory and syslogd.msg in the c:\nwserver\nls\4 directory. NetWare 6.5 SP3 and NetWare 5.1 SP8 automatically install the syslogd files. The syslogd daemon has not been tested on other versions of NetWare.
1.8.5 Isolating Memory Corruption
For most memory corruption problems, you can load your module with the -m option (module_name -m). This option is usually all that is needed to isolate and find a memory corruption problem. This option catches the following types of problems:
-
Memory overruns. The -m option causes every memory allocation to be justified to the end of the memory page with a guard page mapped in as the next page. If the end of the memory block is ever overwritten, a page fault occurs and the server abends at the point memory corruption begins rather than a long time afterwards.
-
Writes to already freed memory. Because each allocation has its own page and the page associated with each allocation is mapped out during the call to free the memory, any future writes to the page results in a page fault and a server abend at the point memory corruption begins.
1.8.6 Using Server Load Parameters
At start up, you can add a number of parameters to the server.exe command, which can help you isolate errors. For example:
server -nl
This command disables the splash screen. The following parameters are supported on NetWare 5.1 SP3 or later, unless otherwise noted.
Table 1-6 Server Load Parameters
1.8.7 Using the NetWare Debugger after an Abend
An abend is an abnormal end to a program. There are two basic types of abends:
-
Processor-detected abends, which occur when a processor detects an error, such as reading from or writing to nonexistent memory. The words, “Processor Exception” always appear in the abend message, along with the type of abend such as “Page Fault” or “Machine Check.”
-
Code-detected abends, which occur when the operating system discovers a problem through one of its numerous checks that are in place.
The purpose of an abend is to halt the system so that you can perform further debugging and determine the root cause of the corruption.
You can enter the internal debugger on the server to find the problem or you can create a core dump of the server's memory and use the NetWare Virtual Debugger to find the problem. Both the internal and virtual debuggers have similar functionality and similar commands. They display the information in Assembly instructions. Even if you do not have a knowledge of the Assembly language, you can learn to recognize how C code has been translated into Assembly.
Walking the Stack
One of the most useful tasks you can learn in the debugger is the process of walking the stack. This consists of unwinding the stack, with the process removing from the stack what has already been done until you reach the state when the server stopped running.
The stack itself is similar to a bread trail, with the processor leaving behind a line of bread crumbs on the trail showing where it has been. Walking the stack is the ability to walk back along that trail, picking up the bread crumbs.
Working with the Stack
When working with the stack, you need to remember two things:
-
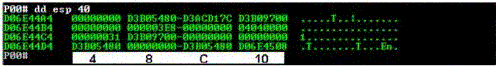
Counting is in hexadecimal.When walking through the stack trail, remember that each long on the stack counts as 4 hex digits. Therefore, to count paragraphs on the stack, you would count 4, 8, C, 10.
-
The ESP register holds the current stack pointer. This is the starting point to help you determine what has occurred.
The figure below illustrates a typical stack trail. One line is considered a paragraph. Four paragraphs are shown in the figure.
Six typical instructions change the stack: PUSH, POP, ADD, SUB, CALL, and RETURN. These instructions perform the following tasks:
-
PUSH pushes a value onto the stack
-
POP removes a value from the stack
-
ADD, when done to ESP, removes items from the stack
-
SUB, when done to ESP, adds items to the stack
-
CALL PUSHes a return address onto the stack
-
RETURN POPs a return address off the stack
Understanding a Call
To troubleshoot an abend, you must first understand what happens on the stack when a call is made. At the time of the call, the instruction that follows the call is PUSHed onto the stack. This it known as the RETURN address and is always the instruction immediately following the CALL command.
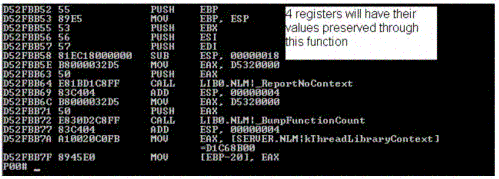
At this point of the CALL, execution is moved to the new function. Most C functions then preserve some of the register's values, such as the EBX, ESI, EDI, and EBP registers. The function restores the preserved values after the function is finished.
After the register preserve values, space in the stack is reserved for local variables with the SUB ESP, X command, where X specifies the amount of space. The figure below illustrates what the beginning of a typical function looks like in the debugger. Each compiler has slight variations to this sequence.
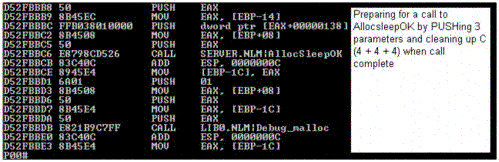
As you continue down through the execution of the function, you will discover that one function eventually calls another function. This is preceded by PUSHing the parameters to the function onto the stack, then CALLing the function, which then PUSHes register value preserves and SUBs the local variables. The following figure illustrates two calls being made. First, the parameters are PUSHed on the stack, which is followed by the actual CALL opdoce, and then followed by the ADD ESP, C call that cleans up the stack.
When walking the stack, you need to remove the following items:
-
Parameters
-
CALL (return address)
-
Preserves
-
Locals
By going through the list, you can walk back through the stack far enough to determine which application function sent bad parameters. This will help you find the cause of the problem.
1.8.8 Tracking Memory Leaks with LibC
LibC tracks memory allocated using malloc, calloc, realloc, and NXMemAlloc functions, as well as other less obvious heap allocations belonging to an NLM. In NetWare 6, if an NLM is unloaded without its memory allocations cleaned up, the presence of the developer option flag causes an allocation message to be printed to the NetWare Console Logger screen upon unload. (On former versions of NetWare, this happened whether or not the developer option was set).
To turn the developer option on (in autoexec.ncf or at the NetWare System Console command line), enter:
set developer option = on
To pass NLM Certification, this option must be on and the NLM must unload cleanly without generating any memory allocation messages. To facilitate locating the source of such messages, LibC has a memory tracking facility that uses the NetWare internal debugger.
To enable the memory tracking facility:
-
Load a debug copy of LibC on the server (dated mid-July 2002 or later).
-
Enter the debugger with the following key strokes. (All keys must be held down together, including both Shift keys.)
LeftShift+RightShift+Alt+Esc
-
At the keyboard enter
nlm track memory on
g
Every NLM loaded after these commands has memory tracking turned on.
-
Load your NLM as usual.
-
Let your NLM run for a while, then unload it.
When your NLM unloads, you will get a short stack trace display on the System Logger screen from the allocation point backwards. The trace usually has enough context to pinpoint the exact location of the allocations that aren't ultimately freed.
This trace is not perfect and can contain false artifacts that you must ignore. These artifacts are usually uninitialized local variables where old return addresses are still on the stack. Using a DEBUG compile that preinitializes local variables largely eliminates this problem, although there could still be valid code addresses in the stack trace that are not really part of the call path.
Memory tracking is on until you reboot the server or turn it off.
HINT:Trace messages are sent to the System Logger screen. You can save these messages to c:\nwserver\logger.tx by switching to the System Logger screen and pressing F2. Press F1 for details.
-
To turn off memory tracking, enter
nlm track memory off
-
To discover the current status of memory tracking, enter
track memory status
This query returns On if memory tracking is enabled and Off if memory tracking is not enabled.
-
To view additional tracking, enter
libc track memory on
This command tracks memory that LibC allocates on behalf of your NLM and whose leakage also indicates failure to release a resource such as closing a service, deregistering for notification, or failing to call dlclose after obtaining a handle using dlopen.
NOTE:No LibC prior to Support Pack 6 (NetWare 5.1), Support Pack 3 (NetWare 6.0), or NetWare 6.5 reliably offers this feature. Prior to this time, and starting about mid-July 2002, the following command performed some of this functionality: libc track memory status
The logger screen has a default size of about 240 KB, which sometimes can be too small to hold all of the messages generated by this memory tracing tool. You have two choices:
-
You can fix the displayed leaks, knowing that the lost leaks will eventually display as you fix the known problems.
-
You can increase the buffer size of the logger screen with the following command line switch when server.exe is started:
server -lsbuffersizeReplace buffersize with a value from 240 to 1024.
1.8.9 Adding Breakpoints
When you are debugging your application, you can insert breakpoints into the instructions of the program. NetWare supports two types of breakpoints:
-
Hardware Breakpoints. You can set up to 4 simultaneous breakpoints on the processors. These breakpoints are implemented using the x86 processor family's breakpoint registers. The hardware breakpoint functions allow execution, read, and write breakpoints to be set. When the address of the breakpoint is executed, read, or written, the processor causes an exception that is handled by the NetWare internal debugger. The result is that the NetWare server's execution is stopped and the internal interactive debugger is activated at the execution point of the exception, allowing the developer to examine the state of the machine.
Use the following functions to implement and manage hardware breakpoints:
-
Soft Breakpoints. You can set up any number of execution breakpoints. These breakpoints are not implemented on the processor, but by the NetWare debugger itself. When the execution of the CPU reaches the soft breakpoint, the debugger causes a developer-provided callback to be called. If the callback returns EXCEPTION_HANDLED, execution resumes. If the callback returns any other value, execution is stopped and the internal debugger is activated, allowing the developer to examine the state of the machine.
Use the following functions to implement and manage soft breakpoints:
1.8.10 Novell Remote Manager
Novell Remote Manager (NRM) has a Profile/Debug option that allows you to perform the following tasks:
-
Profile CPU execution by NLM
-
Obtain information about a thread's state and execution time
-
Profile processor tasks, memory, and calls
If you load the debug version of libc.nlm (included in the SDK) on your development server, a LibC Applications screen becomes available in NRM. From this screen, you can determine what LibC is doing which might shed some light on what your application is doing.
For more information, see the documentation for NRM: