Administrator's Guide
CHAPTER 7
This chapter describes how to perform some typical maintenance tasks on the Novell exteNd Application Server. It has sections on:
You can use the SMC to remotely administer servers. You can administer as many servers as you want from one SMC console. If you are running a server in a cluster, you can choose additional server clusters to administer.
 For more information about server clusters, see Server clustering.
Make sure the server you want to administer is up and running.
Select the Choose (server) icon.
|
Parameter |
Description |
|---|---|
|
server |
The name of the server (such as localhost or http://hostname). |
|
port |
The administration port. You need to specify the port only if it is not the default port for your operating system.
|
The application server supports an environment variable called AGCLASSPATH, which allows you to extend the Java classes available to your applications. You can use AGCLASSPATH, for example, when you want to include third-party elements such as database drivers with your application. Use this variable instead of the +cp Java class path option described in Starting the application server. The application server overrides the CLASSPATH variable.
The Deployment Options section of the SMC provides access to information about the J2EE objects that have been deployed on the server:

The following table describes the functionality for each of the panels:
The Deployed Objects panel lists:
 For more information, see the J2EE deployment chapter in the Facilities Guide.
 To manage deployed J2EE objects:
Expand the database containing the deployed objects you want to manage:
You can Undeploy WARs, EARs, CARs, and RARs.
Select a deployed object and perform one of the following actions.
The deployed resource adapters are displayed in the dropdown.
Select a resource adapter from the list to display the adapter's settings.
Choose the radio button for the function you want to perform:
 To specify the default database URL:
Choose the database whose default page you want to set from the Database dropdown.
 To specify the default server URL:
Select the Server URL radio button (it is selected by default).
Enter an URL in the URL text box and click set Default URL.
The URL should be a server-relative URL and should include the database name (the same database you chose from the Database dropdown in the procedure above).
If your applications are deployed to the SilverMaster database, you do not need to include a database name.
The application server supports J2EE transactions via the Novell exteNd Transaction Manager (TM), which is part of the Novell exteNd Messaging Platform. The TM is the transaction service for the ORB. It provides an implementation of the JTA TransactionManager and UserTransaction interfaces. These interfaces represent the contract between the transaction manager and the application server, and between the transaction manager and user applications.
You can use the SMC to specify settings for the TM transaction log, the resources the TM uses to recover transactions, and so on.
How the TM recovers transactions Transactions need to be recovered when the server suffers a catastrophic error and needs to be restarted. Here is the process the TM performs at server restart:
The TM determines that a transaction needs to be recovered when items in the log have been prepared for a transaction but the transaction did not complete (in other words, the transaction did not commit or roll back).
The TM creates a number of worker threads (you specify the number via the SMC, as described in the procedure below). These worker threads are used to recover the incomplete transactions.
If a transaction includes access to a remote resource (like a CORBA resource), the worker threads will attempt to access those same resources. If the worker threads are unable to locate a remote resource, the worker thread will sleep for a specified length of time (the Resource recovery retry time limit specified in the SMC) before it attempts to access the resource again. In the meantime, the other recovery worker threads work on other incomplete transactions in the log.
 To specify Transaction Manager settings:
Specify the settings as follows:
The SMC provides several options that allow you to monitor server activity easily. These options are described in the following sections:
You can display real-time charts of various server statistics.
 To display a chart of server activity:
The Add Plot dialog displays, allowing you to choose which statistics you want to chart. The statistics are divided into categories.
Select a statistic you want to chart and click Add. Statistics marked with  are count values; statistics marked with
  record changes in values.
The statistic is added to the table below the chart. The current value of the statistic is shown, as is the color of the plot line that will be generated.
(Optional) Select additional statistics, clicking Add after each one.
When you have selected all the statistics you are interested in, click Close.
What happens The application server plots all statistics you have specified and displays the exact values in the table below the chart. By default, the values are refreshed every five seconds. (To change this, enter a new number in the Refresh Interval box.)
By default, the statistics you are plotting are not saved and reloaded between sessions of the SMC.
Click the Reload current chart on start button at the bottom of the Charts panel.
Specify a file name or choose the ellipsis to choose a file from the file system.
The charting data is saved to an XML file that is read each time you restart the SMC.
By default, the statistics you chart are not saved.
Click the Log chart data to file button at the bottom of the Charts panel.
Specify a file name or choose the ellipsis to choose a file from the file system.
Specify the log file size or specify 0.
If you specify a log file size: when that file size is reached, the data is dumped to a file of the same name—but with the timestamp appended (to make the files unique).
If you specify 0: there is no limit on how large this file may grow (except the limits imposed by the file system).
The data is saved to a tab-delimited file.
You can change the scale of the Y-axis by specifying a new value in the Scale field (the default is 100). You can also change how often the application server updates the values by changing the value in the Refresh interval field (the default is every five seconds).
It may be that you are plotting different statistics with very different scales but want them to appear clearly in the chart. To do this, you can change the multiplier for particular plots to equalize the values and make the chart easier to read.
Once you have charted a set of statistics that you are interested in, you can save the specification of the statistics set in a file so that you can easily view the set of statistics later.
NOTE: The file stores the list of statistics that are plotted but does not store the statistics' values.
Specify the file you want to save the statistics set in. The default extension is XML.
You can view the statistics set later by clicking Load, as described next.
 To view a statistics set you have saved:
If you have enabled server logging and are using the built-in logging class to log to the database, you can display the log(s) in real time in the SMC. (If you are logging to a file or using a custom class to do the logging, you can't display the log in the SMC.) As an alternative, you can use the PrintLog SilverCmd.
 For more information about server logging, see Using server logging.
Update the log by clicking Refresh (the log does not update automatically)
Resize a column by placing the mouse pointer on the column's right border and dragging the mouse
View the message by double-clicking on the row or clicking Log Detail
You can display in the SMC tabular views of server statistics related to individual sessions and threads, as well as a summary of server activity.
 To access server statistics in a view:
About the statistics The sections that follow describe the statistics that are displayed.
This tab displays statistics for each current client session:
Viewing statistics in a browser You can also display these statistics in a browser. Point your browser to http://server/SilverStream/Sessions.
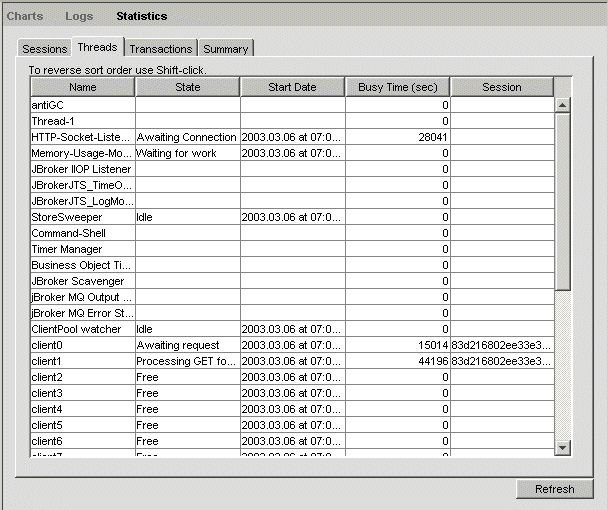
This tab displays statistics for each server thread:

Following is a description of each of the fields:
|
Thread statistic |
Description |
|---|---|
|
Name |
Nonclient threads are used for various internal tasks (such as cleaning up server data structures). Client threads handle incoming requests. There should be at least as many client threads as there are Maximum number of client connections listed in the SMC Connections panel (see Client connection parameters). |
|
State |
A brief description of the current state of the thread. |
|
Start date |
The start date for the thread. In many cases this date is the same as when the server was started. But for dynamically allocated threads this value will be different. |
|
Busy time |
The elapsed time (in seconds) since the thread has been actively working, as opposed to waiting. This value reflects how busy the server is in general. |
|
Session |
An internal session ID for this thread. See the Sessions tab to determine user/host information. |
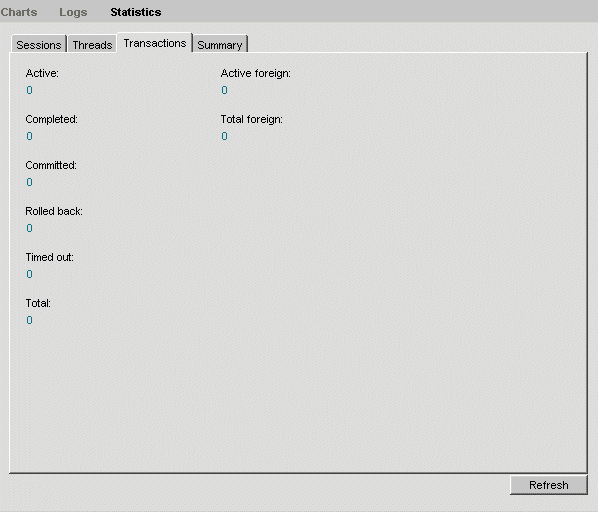
This tab provides statistics for transactions managed by the Novell exteNd Transaction Manager (TM):

Following is a description of each of the fields:
This tab provides access to different types of category summaries. The following describes the items for each tab selection:
Request time statistics The statistics for this tab are enabled only when HTTP logging is enabled. For a description of HTTP logging, see Using server logging.
Memory statistics The statistics for this option apply to the Java Virtual Machine (JVM).
Thread statistics This option provides statistics about client threads that handle incoming client connections.
|
Thread statistic |
Description |
|---|---|
|
Free thread count |
The current number of threads not associated with a client connection and available for immediate use. |
|
Idle thread count |
The number of threads associated with a client connection but not currently handling a user request. |
|
Total thread count |
The total number of client threads allocated. This number should be equal to the Maximum number of client connections in the SMC Connections panel (see Client connection parameters). |
Viewing statistics in a browser You can also display most of these summary statistics in a browser. Point your browser at http://server:port/SilverStream/Statistics. The page updates itself automatically every five seconds.
The application server provides Web server integration (WSI) modules that allow you to redirect requests for selected pages served by your Web server to an application server. You can use these WSI modules to integrate a Novell exteNd Application Server with your Web server.
 For more information, see Using the Web Server Integration Modules.
Copyright © 2004 Novell, Inc. All rights reserved. Copyright © 1997, 1998, 1999, 2000, 2001, 2002, 2003 SilverStream Software, LLC. All rights reserved. more ...