8.4 Designing a Custom Query Report
After you have created a Custom Query Report, either through the Report Designer Query Editor or the Query Editor built into the browser-based administration interface, you can design the layout of the report.
NOTE:This exercise introduces you to some of the very basic design features of the Report Designer. Through familiarizing yourself with the basic features, you will become proficient enough in the interface to try more advanced features.
-
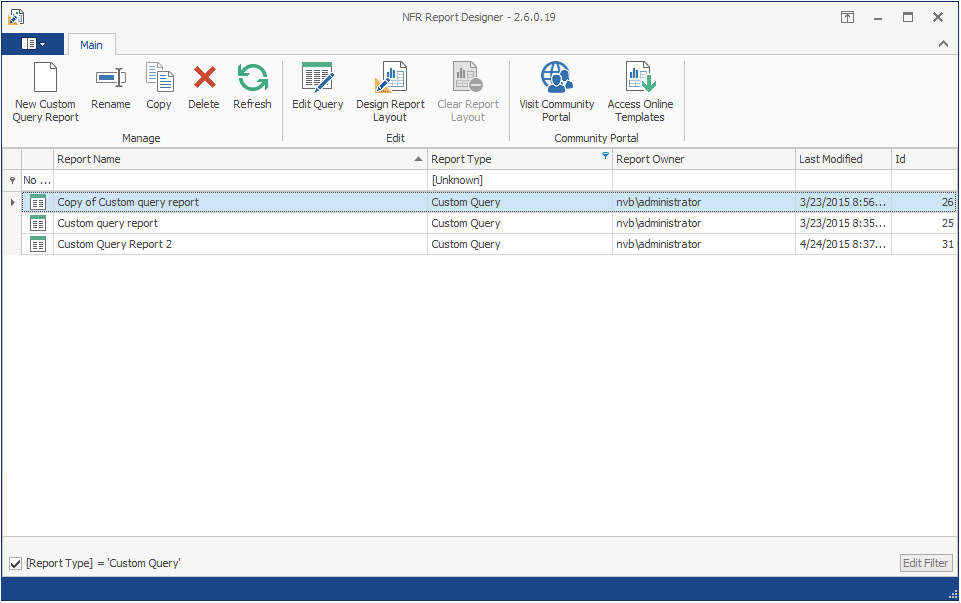
From the listed Custom Query Reports, select the one you want to design.
-
Click .
-
Click .
-
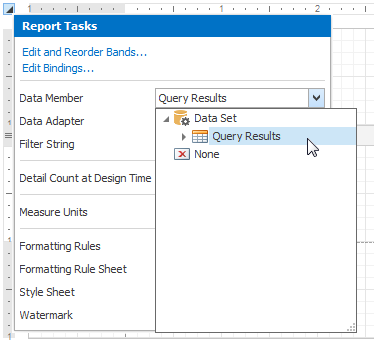
In the upper-left corner of the layout grid, from the drop-down menu, select .
This action properly ties the data to the Report Designer.
-
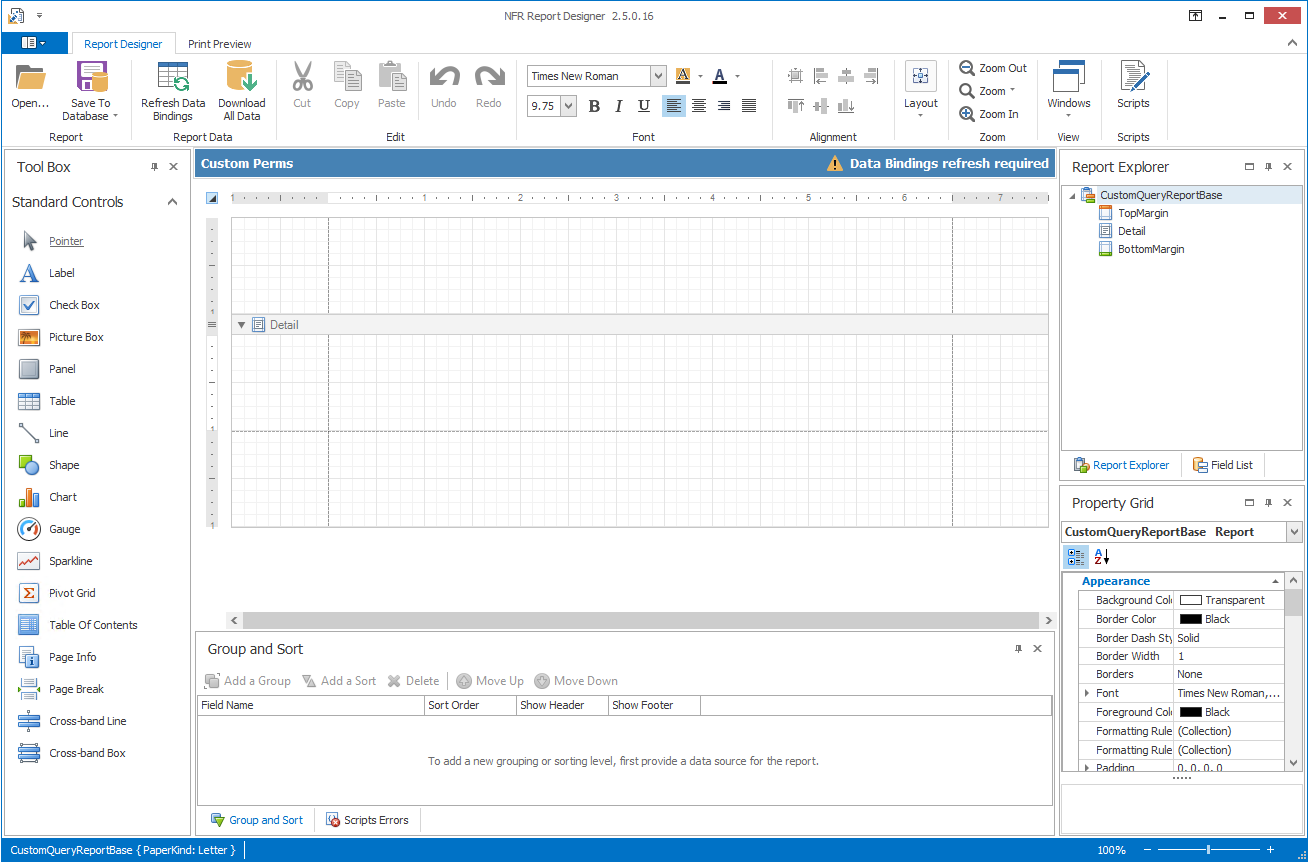
At the bottom of the region, click .
-
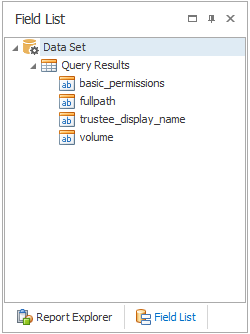
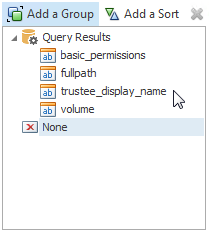
Expand the to show all of the result fields of the Custom Query Report.
-
Drag the result fields to the region of the layout grid.

-
Resize the frame so the bottom is aligned with the bottom of the four report elements.

-
Right-click above the frame and select >.
-
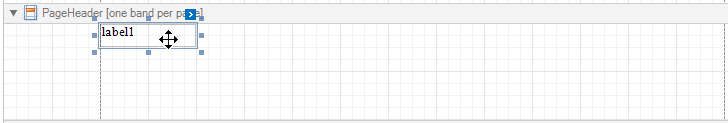
From the , drag a over to the new frame and line it up above the first report element.
-
Repeat Step 10 for each label you want to have in the report.
-
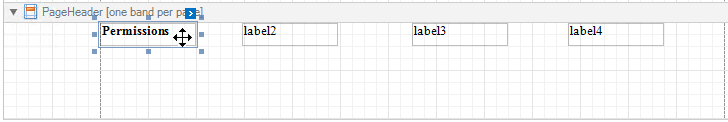
Edit the label names.
-
Resize the frame so the bottom is aligned with the bottom of the report elements.
-
Click the button.
-
When the confirmation dialog box appears, click .
-
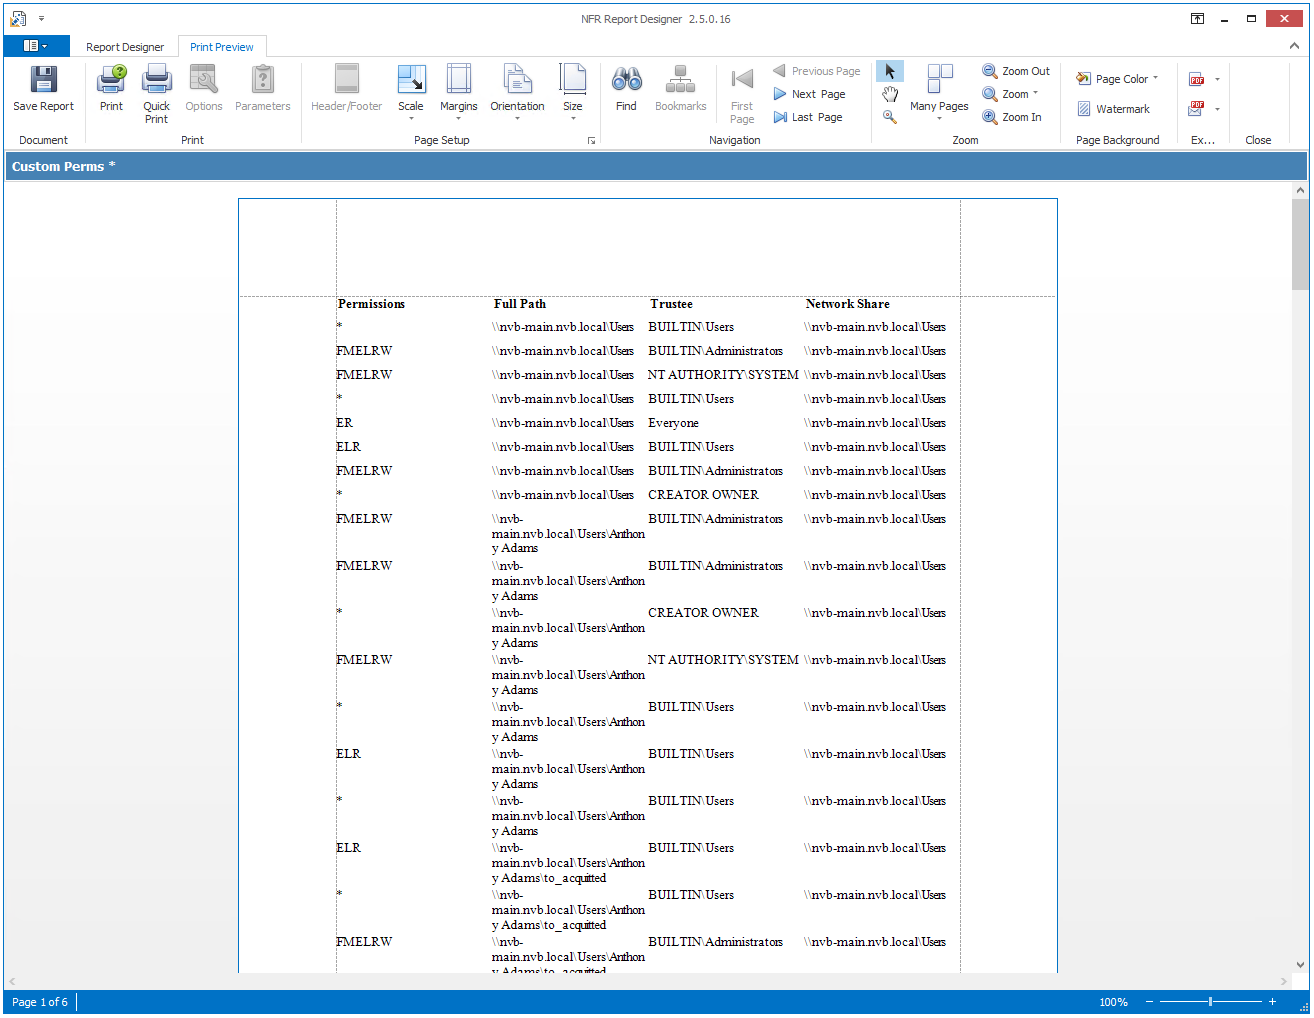
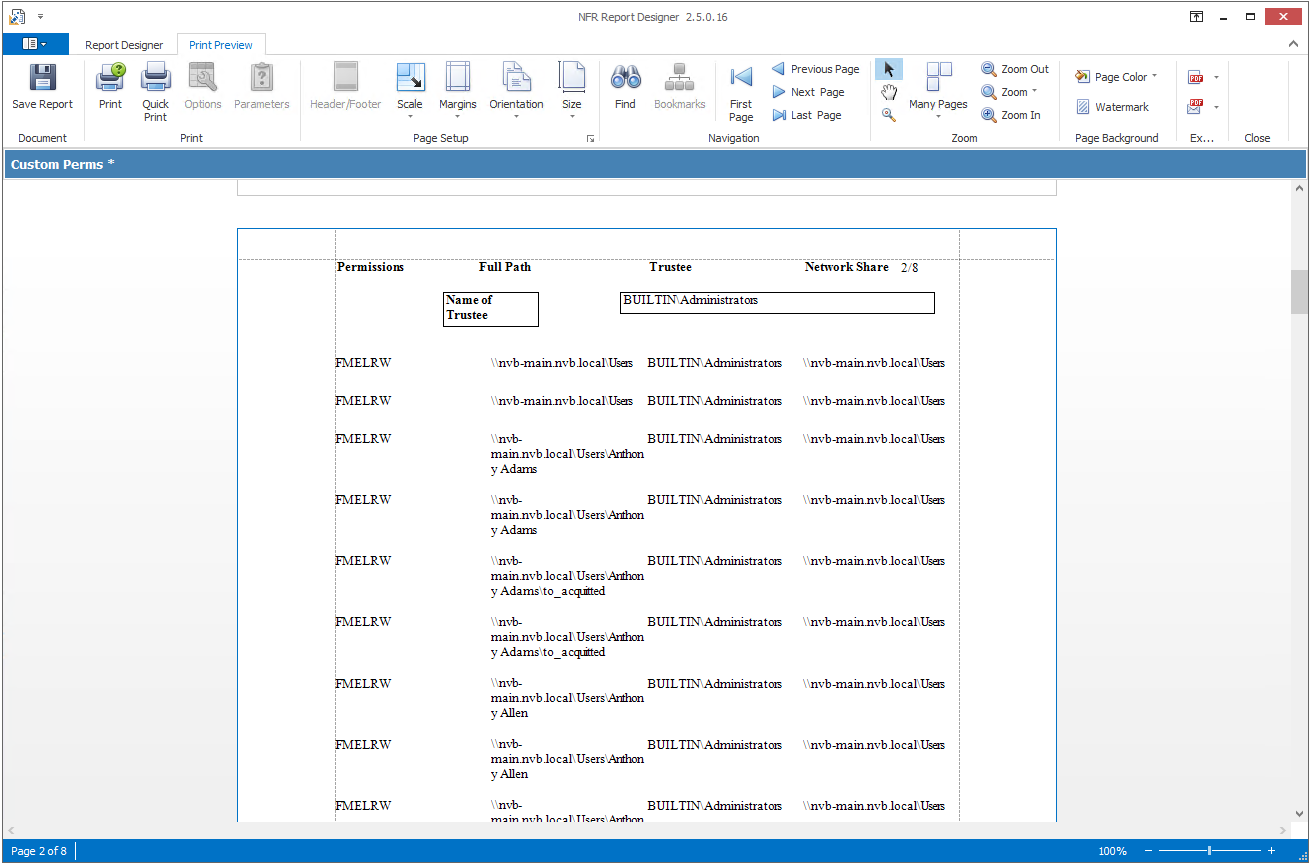
Click to view how the report looks up to this point.
-
Click the tab.
-
Right-click above the frame and select > .
-
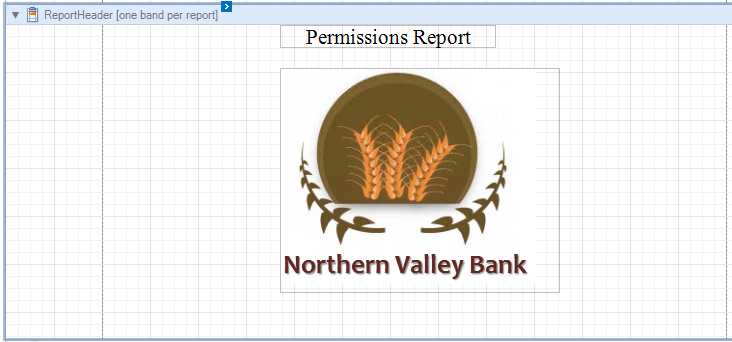
From the , drag a over to the new frame and center it at the top of the frame.
-
Enter a name for the report.

-
From the , drag a below the report title.
-
Activate the frame, click the > and from the field, click the ellipses (…) to select a graphic.
-
From the , drag a over to the frame and center it below the graphic.
-
In the new label, enter today’s date.
-
From the , drag a Page Break to the frame and below the date label.
-
From the , drag a to the right of the furthermost label on the right in the frame.
You might need to adjust the width of the frame.

-
From the region, select and select one of the result fields you would like the report to sort.
-
From the , drag a over to the new frame.
-
Give the label a descriptive name.
-
From the region, expand the .
-
Drag the applicable report element into the GroupHeader1 frame, next to the label you just named.
-
If necessary, expand the length of the report element.
-
Select both items in the frame; from the region, for the setting, select .
-
Adjust the depth of the frame so that it has the desired space you want from the columns in the report.
-
Click .
-
Click to save the report.
-
When notified that the report definition was successfully saved to the database, click .