Generating Reports
You can generate reports on demand at the Monitor Agent console to help you manage message flow throughout your GroupWise system.
- Link Trace Report
- Link Configuration Report
- Environment Report
- User Traffic Report
- Link Traffic Report
- Message Tracking Report
- Performance Tracking Report
Link Trace Report
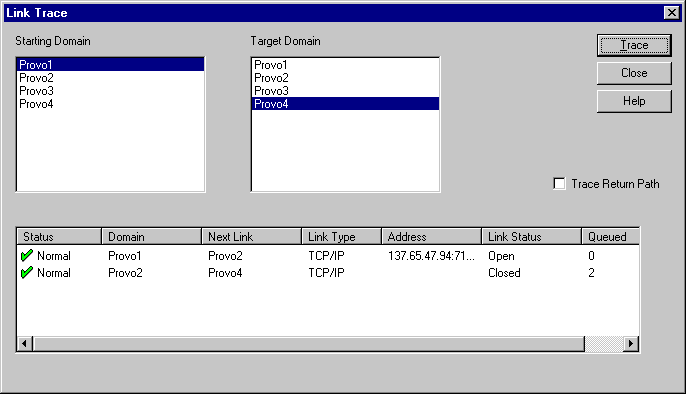
A link trace report enables you to follow the path a message would take between two GroupWise domains. A link trace report includes a list of all the domains through which a message would need to pass, along with their current status, link type, address, and number of messages currently queued in each domain. If any domain along the link path is closed, an error message is displayed.
If a message fails to arrive at its destination, this report can help you pinpoint its current location, so you can resolve the problem and get messages flowing smoothly again.
At the Windows Monitor Agent console:
-
Click Reports > Link Trace.
or
On Linux, click Link Trace.
-
Select a starting domain and a target domain.
-
If you want to trace the path back, which is the route status messages will take, select Trace Return Path.
-
Click Trace.

If any domain in the path is closed, an error message displays so you know where the problem is occurring.
-
When you are finished tracing links, click Close.
Link Configuration Report
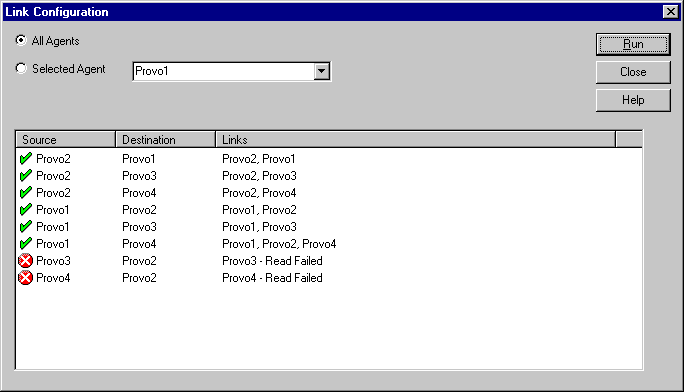
A link configuration report enables you to list the links from one or more GroupWise domains to all other domains in your GroupWise system. This helps you identify inefficient link paths, loops, and unreachable domains. All domains must be open to obtain an accurate link map of your GroupWise system.
At the Windows Monitor Agent console:
-
Make sure all domains in your GroupWise system are open.
You cannot obtain an accurate link map of your GroupWise system if any domains are closed. For assistance with closed domains, see "Message Transfer Agent Problems" in GroupWise 6.5 Troubleshooting 2: Solutions to Common Problems.
-
Click Reports > Link Configuration
or
On Linux, click Link Configuration
-
Select All Agents
or
Select a specific agent from the drop-down list.
-
Click Run

The list shows what domains a message would pass through to travel from the domain in the Source column to the domain in the Destination column. If a domain displays as closed, it means that the Monitor Agent could not contact the MTA for the domain or that a loop was detected in the link configuration.
-
When you are finished checking links, click Close.
Environment Report
An environment report lists all monitored agents, along with each agent's location, version, IP address, port number, and operating system information. For NetWare® agents, the server name, CLIB version, TCP/IP version, Novell eDirectoryTM version, and the number of packet receive buffers are also listed.
At the Monitor Agent console:
User Traffic Report
A user traffic report enables you to determine how many messages a user has sent outside his or her post office. The user traffic report lists all messages sent by a specified user during a specified date/time range, along with date, time, and size information for each message. You can also generate a user traffic report for all users whose messages pass through a selected domain.
In order for the information to be available to generate a user traffic report, you must configure the MTA to perform message logging. See Enabling MTA Message Logging.
At the Monitor Agent console:
-
Click Reports > User Traffic.
-
Select the user's domain or the domain you want to generate a user traffic report for.
-
Type the GroupWise user ID that you want to create a report for.
or
Leave the field blank to create a report for all users whose messages pass through the selected domain.
-
If you want to restrict the report to a particular time interval, specify start and end dates and times.
-
Click Run.
-
After the results are displayed, click Save, provide a filename for the report, select the format for the report, then click OK.
Reports can be saved in comma-separated or tab-separated format to meet the needs of the program you plan to use to display and print the report. For example, you could bring the data into a spreadsheet program. If needed, you can include column headings to create an initial line in the output file that labels the contents of each column.
-
When you are finished generating user traffic reports, click Close.
Link Traffic Report
A link traffic report enables you to determine how many messages are passing from a selected GroupWise domain across a specified link. The link traffic report lists the total number and total size of all messages passing through the link during each hour or half hour of operation.
In order for the information to be available to generate a link traffic report, you must configure the MTA to perform message logging. See Enabling MTA Message Logging.
At the Monitor Agent console:
-
Click Reports > Link Traffic.
-
Select the source domain of the link.
The list includes all domains that the Monitor Agent uses XML to communicate with. If the Monitor Agent must use SNMP to communicate with a domain, that domain is not included in the list.
-
Select the other end of the link, which could be another domain, a post office, or a gateway.
-
If you want to restrict the report to a particular time interval, specify start and end dates and times.
-
Click Run.
-
After the results are displayed, click Save, provide a file name for the report, select the format for the report, then click OK.
Reports can be saved in comma-separated or tab-separated format to meet the needs of the program you plan to use to display and print the report. For example, you could bring the data into a spreadsheet program. If needed, you can include column headings to create an initial line in the output file that labels the contents of each column.
-
When you are finished generating link traffic reports, click Close.
Message Tracking Report
A message tracking report enables you to track an individual message through your GroupWise system. The message tracking report provides information about when a message was sent, what queues the message has passed through, and how long it spent in each message queue. If the message has not been delivered, the message tracking report shows where it is.
In order for the information to be available to generate a message tracking report, you must configure the MTAs in your GroupWise system to perform message logging. See Enabling MTA Message Logging.
In addition, you need to determine the message ID of the message. Have the sender check the Sent Item Properties of the message in the GroupWise client. The Mail Envelope Properties field displays the message ID of the message; for example, 3AD5EDEB.31D : 3 : 12763.
At the Monitor Agent console:
-
Click Reports > Message Tracking.
-
Type the message ID of the message to track.
You can obtain the message file ID in the GroupWise client. Open the Sent Items folder, right-click the message, click Properties, then check the Mail Envelope Properties field for the message file ID; for example, 3A75BAB9.FF1 : 8 : 31642.
-
Select the domain where you want to start tracking.
-
Click Track.
-
When you are finished generating message tracking reports, click Close.
Performance Tracking Report
Before you can run a performance tracking report, you must configuration the Monitor Agent for performance tracking. See Measuring Agent Performance.