

  |
You can monitor various appliance activities and statistics in the browser-based tool.
Path: Monitoring > Summary
Figure 92
Summary Tab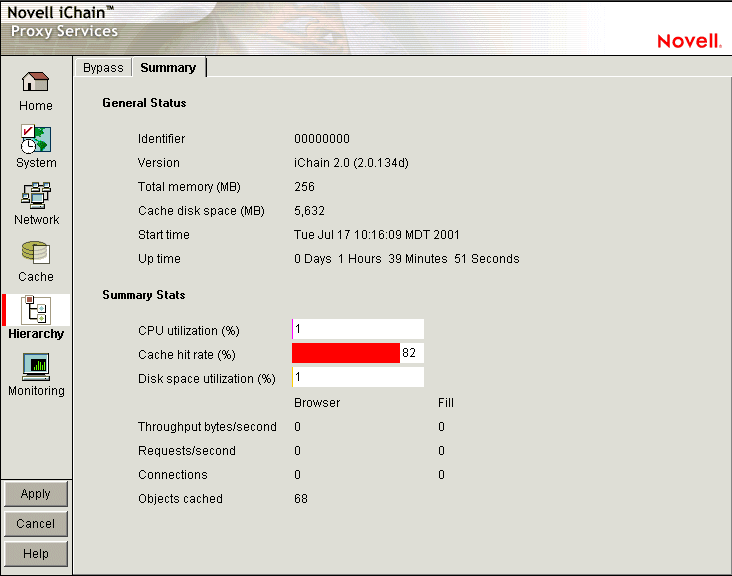
The Summary tab shows key appliance statistics at a glance. Statistics are refreshed every second.
Identifier: The make, model, and serial number of the appliance.
Version: The current system software version.
Total Memory (MB): Total available memory.
Cache Disk Space (MB): Total disk space available for caching. The amount shown is smaller than the total appliance disk space because it doesn't include the operating system and log partitions. Check this field to verify whether the proxy server has detected all disks installed on the appliance.
Start Time: The last time the appliance was started.
Up Time: Total time the appliance has been running since last started.
CPU Utilization (%): The current CPU utilization rate. Use this chart for capacity planning.
Cache Hit Rate (%): The current cache hit rate. A high cache hit rate indicates that the caching system is off-loading significant request processing from Web servers whose objects have been cached. Use this chart for capacity planning.
Disk Space Utilization (%): The percentage of caching disk space currently in use.
Throughput Bytes/Second: Current throughput.
Requests/Second: The rate at which browser clients are requesting Web objects.
Connections: The total number of TCP connections that are active, idle, or closing.
Objects Cached: The total number of Web objects that have been cached.
Path: Monitoring > Services
Figure 93
Services Tab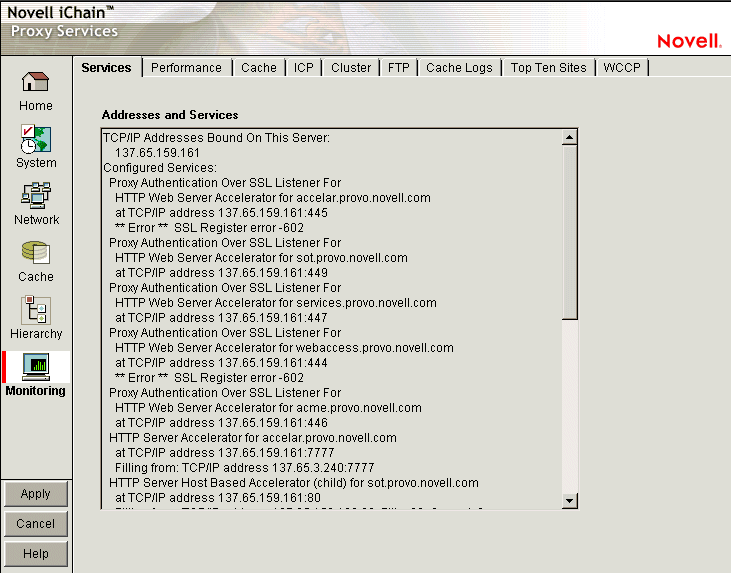
The Services tab shows you the IP addresses that are bound to appliance network cards and the services that are active. This information is refreshed every minute.
Addresses and Services: Use this list for troubleshooting problems with configured services. It shows active services along with the IP addresses and ports that they are running on. When the appliance detects errors, it displays appropriate error messages next to the services.
Path: Monitoring > Performance
Figure 94
Performance Tab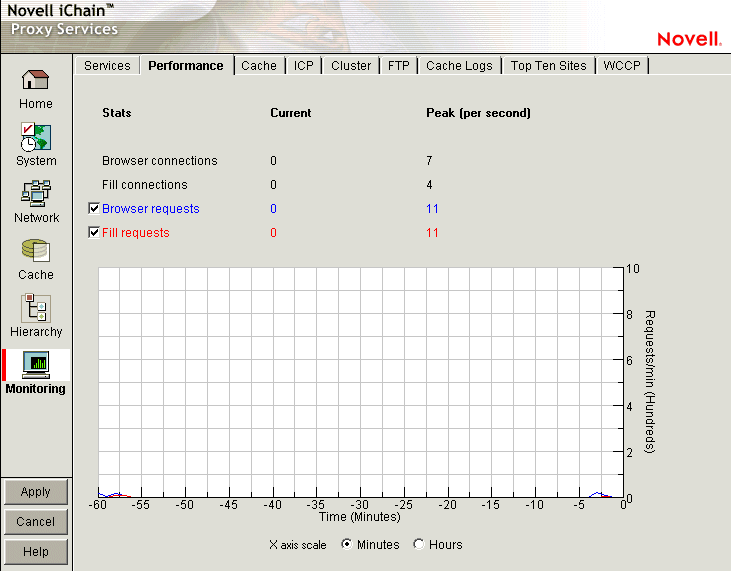
The Performance tab shows current and peak levels of usage in terms of TCP connections and HTTP requests. The tab also displays a graph of HTTP requests from browsers to the appliance and from the appliance to origin Web servers.
Statistics are updated every ten seconds. The graph is updated once a minute.
Browser Connections: The current and peak numbers of browser connections to the appliance.
Fill Connections: The current and peak numbers of connections that the appliance has opened to origin Web servers.
Browser Requests: The current and peak numbers of browser HTTP requests per second made to the appliance. Check this box to enable graphing of browser requests.
Fill Requests: The current and peak number of appliance requests per second to origin Web servers. Check this box to enable graphing of requests to origin Web servers.
Requests Graph: The HTTP browser requests to the appliance per minute (blue line) and HTTP fill requests to origin Web servers per minute (red line). Click Minutes or Hours to select the scale of the X axis. Minutes displays a one-hour history; Hours shows a 24-hour view.
Path: Monitoring > Cache
Figure 95
Cache Tab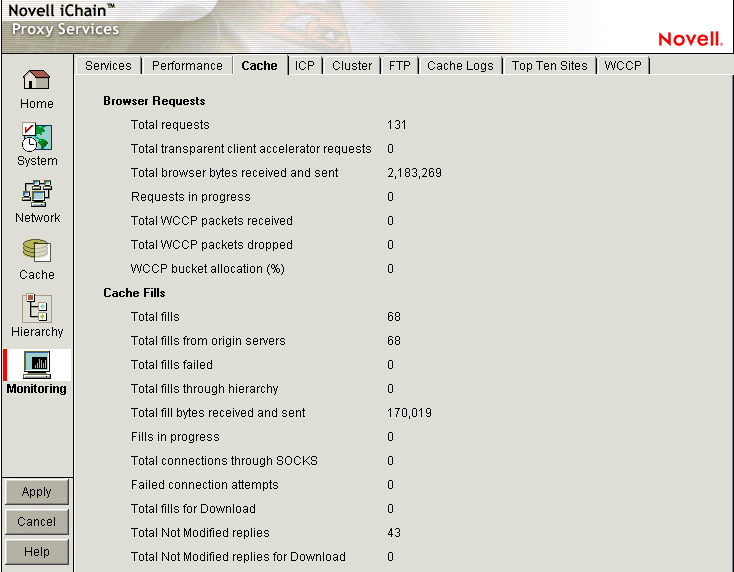
The Cache tab shows statistics for browser requests to the appliance and for appliance requests to origin Web servers. Statistics are refreshed every ten seconds.
Total Requests: The total number of requests that browser clients have made since the appliance was started.
Total Transparent Proxy Requests: The total number of transparent proxy browser requests that came directly to the appliance or were routed to it through an L4 switch.
Total Browser Bytes Received and Sent: The total bytes that browser clients have sent to and received from the appliance.
Requests in Progress: The number of active browser requests that are currently being processed by the appliance.
Total WCCP Packets Received: The total number of packets that have been redirected to the appliance by a WCCP-capable router.
Total WCCP Packets Dropped: The total number of packets routed to the appliance from a WCCP-capable router that were dropped by iChain Proxy Services.
Packets are dropped for one of two reasons: either iChain Proxy Services did not expect the packets to be redirected or the packets were malformed. If the transparent proxy service has an Exception IP addresses list, iChain Proxy Services does not expect the router to redirect packets bound for addresses in the list. Use this field to troubleshoot operational problems with WCCP.
WCCP Bucket Allocation (%): The percentage of hash buckets allocated for this appliance. The higher the percentage, the more requests the router redirects to this appliance. If the percentage is 0, the router does not redirect requests to the appliance. Use this field to troubleshoot operational problems with WCCP.
Total Fills: The total number of fill requests the appliance has made to origin Web servers and to neighbors in its cache hierarchy.
Total Fills from Origin Servers: The total number of fill requests the appliance has made to origin Web servers.
Total Fills through Hierarchy: The total number of fill requests the appliance has made to neighbors in its cache hierarchy.
Total Fill Bytes Received and Sent: The total bytes the appliance has sent and received in order to fill its Web object cache.
Fills in Progress: The number of active fill requests that the appliance is waiting for.
Total Connections through SOCKS: The total number of connections the appliance has made through a firewall in order to fill its Web object cache.
Failed Connection Attempts: The total number of failed connection attempts the appliance has made while attempting to fill its Web object cache.
Total Fills for Download: The total number of fill requests sent to origin servers that originated from system read-ahead functionality and batch downloads.
Total Not Modified Replies: The total number of 304 Not Modified replies received for all fill requests to origin servers.
Total Not Modified Replies for Download: The total number of 304 Not Modified replies received for fill requests to origin servers that originated from system read-ahead functionality and batch downloads.
Path: Monitoring > FTP
Figure 96
FTP Tab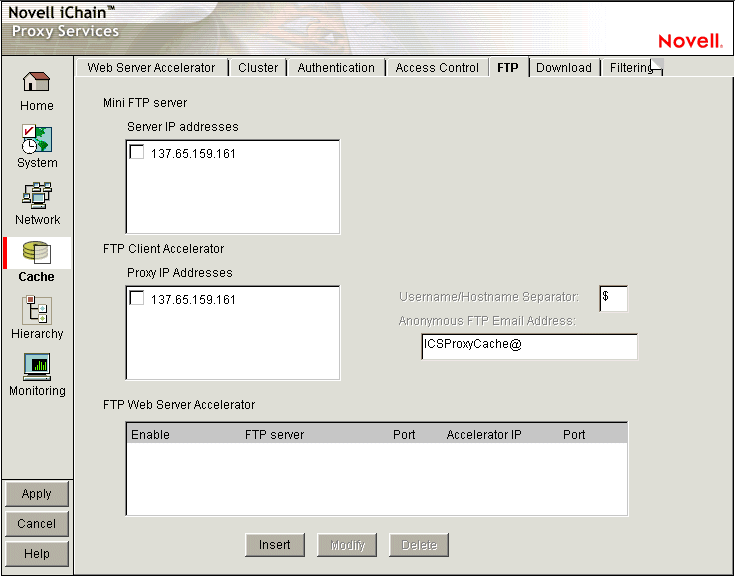
The FTP tab shows key statistics for all FTP transactions. FTP requests through the HTTP proxy are displayed separately from those accessed through FTP proxy. Statistics are refreshed every five seconds.
FTP Accessed through HTTP Proxy: These statistics reflect FTP requests from browsers using the HTTP protocol.
FTP Accessed through FTP Proxy: These statistics reflect FTP requests that used the native FTP protocol.
Path: Monitoring > Cache Logs
Figure 97
Cache Logs Tab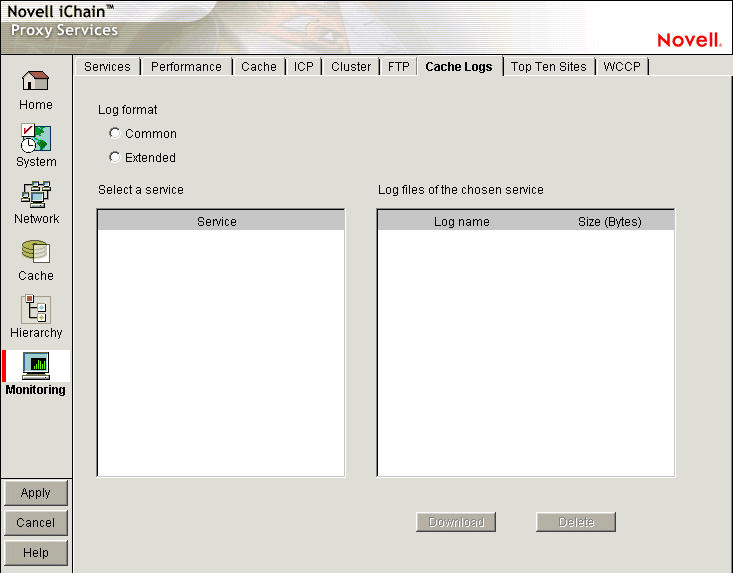
The Cache Logs tab provides access to logs by format and service.
Log Format: These options let you choose the format of the logs you want to download and view.
Select a Service: Clicking a service name displays the associated logs in the Log Files of the Chosen Service list.
Log Files of the Chosen Service: Contains a list of log files matching the format and service options you have selected.
Download: Loads the log file into a separate browser window.
Delete: Removes the log file from the appliance.
Path: Monitoring > Top Ten Sites
Figure 98
Top Ten Sites Tab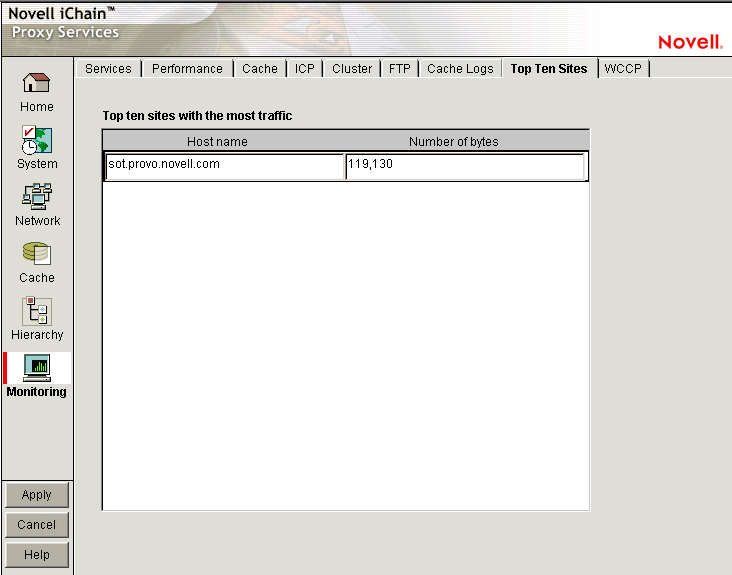
The Top Ten Sites tab displays a list of origin Web servers with more than 0 bytes cached on the appliance. The ten sites with the most total bytes cached are sorted in descending order.
  |