5.1 Data Collection Status
Administrators can enable or disable data collection and view health information about the audit server and event sources.
5.1.1 Enabling and Disabling Data Collection
-
Log into Identity Audit as an administrator.
-
Click in the upper right corner of the page.
-
In the section, administrators can enable or disable data collection at a global level by using the and options. For more information about audit server health status, refer to Section 5.1.2, Viewing Audit Server Health.
-
In the section, administrators can enable data collection at the application level by using the and options. These settings might affect data collection for several servers (for example, multiple eDirectory™ instances). They do not start or stop services on the event source machines.
For more information about event source health status, see Section 5.1.3, Viewing Event Source Health.
Changes on this page take effect immediately.
5.1.2 Viewing Audit Server Health
The Audit Server is a server that listens for connections from Novell applications.
-
Log into Identity Audit as an administrator.
-
Click in the upper right corner of the page.
-
A colored icon beside the Audit Server indicates its health.
Healthy: A green indicator means that the Audit Server is healthy (it is turned on, is listening on a port, and doesn’t have any unresolved errors).
Error: A red indicator means that the Audit Server has experienced an error. For more information, view the server0.*.log files.
Offline: A black indicator means that the Audit Server has been taken offline by an administrator.
5.1.3 Viewing Event Source Health
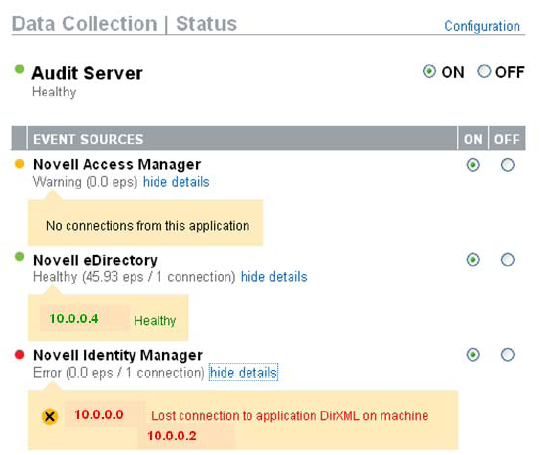
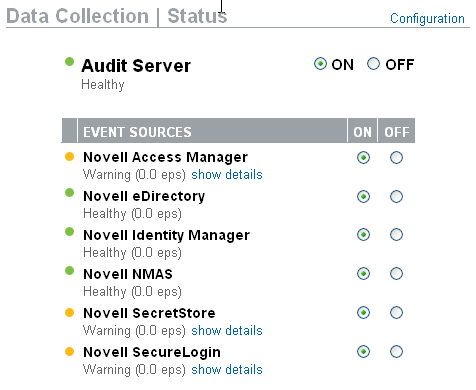
The health status for each Novell application is indicated by a colored icon. For each online data source, Identity Audit also shows the calculated event rate for incoming events. The event rate is recalculated every 60 seconds.
For more information about the health status, including the IP addresses of the individual event sources, click .
-
Log into Identity Audit as an administrator.
-
Click in the upper right corner of the page.
-
A colored icon beside the Novell application indicates its health.
Healthy: A green indicator means that the event source is healthy and Identity Audit has received data from it.
Warning: A yellow indicator indicates a warning condition. A frequent cause is that the application is turned on in Identity Audit but has not sent any data. For example, this could happen if the event source is not configured properly to send data to Identity Audit or if event logging is not enabled for the application.
Error: A red indicator means that the Identity Audit server is reporting an error connecting to or receiving data from this application.
Offline: A black indicator means that the event source has been turned off. Identity Audit is not processing any data from it.
-
Click to see more information, including IP addresses for individual event sources and their associated status.