13.1 Viewing Driver Processes
To view the driver processing events, use DSTRACE. You should only use it during testing and troubleshooting the driver. Running DSTRACE while the drivers are in production increases the utilization on the Identity Manager server and can cause events to process very slowly.
In order to see the driver processes in DSTRACE, values are added to the Driver Set and the driver objects. You can do this in Designer and iManager.
13.1.1 Adding Trace Levels in Designer
You can add trace levels to the Driver Set object or to each Driver object.
Driver Set
-
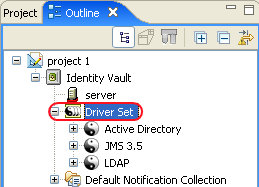
In an open project in Designer, select the Driver Set object in the Outline view.
-
Right-click and select , then click .
-
Set the parameters for tracing, then click .
See Table 13-1 for more information about the Driver Set trace parameters.
If you set the trace level on the Driver Set object, all drivers appear in the DSTRACE logs.
Table 13-1 Driver Set Trace Parameters
Driver
-
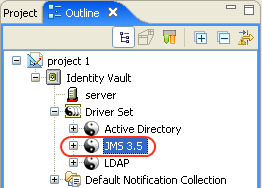
In an open project in Designer, select the Driver object in the Outline view.
-
Right-click and select , then click .
-
Set the parameters for tracing, then click .
See Table 13-2 for more information about these parameters.
If you set the parameters only on the Driver object, only information for that driver appears in the DSTRACE log.
Table 13-2 Driver Trace Parameters
13.1.2 Adding Trace Levels in iManager
You can add trace levels to the Driver Set object or to each Driver object.
Driver Set
-
In iManager, select .
-
Browse to the Driver Set object, then click .
-
Click the Driver Set name.
-
Select the tab for the Driver Set object.
-
Set the parameters for tracing, then click .
See Table 13-1 for more information about these parameters.
Driver
-
In i Manager, select .
-
Browse to the Driver Set object where the Driver object resides, then click .
-
Click the upper right corner of the Driver object, then click .
-
Select the tab for the Driver object.
-
Set the parameters for tracing, then click .
See Table 13-2 for more information.
NOTE:The option does not exist in iManager.
13.1.3 Capturing Driver Processes to a File
You can save driver processes to a file by using the parameter on the Driver object or by using DSTRACE. The parameter on the Driver object is the parameter, under the tab.
The following methods helps you capture and save Identity Manager processes through DSTRACE on different platforms.
NetWare
Use dstrace.nlm to display trace messages on the system console or trace messages to a file ( sys:\system\dstrace.log). dstrace.nlm displays the trace messages to a screen labeled DSTrace Console.
-
Enter dstrace.nlm at the server console to load dstrace.nlm into memory.
-
Enter dstrace screen on at the server console to allow trace messages to appear on the DSTrace Console screen.
-
Enter dstrace file on at the server console. to cpature trace messages sent to the DSTrace Console to the dstrace.log.
-
(Optional) Enter dstrace -all at the server console to make it easier to read the trace log.
-
Enter dstrace +dxml dstrace +dvrs at the server console to display Identity Manager events.
-
Enter dstrace +tags dstrace +time at the server console to display message tags and time stamps.
-
Toggle to the DSTrace Console screen and watch for the event to pass.
-
Toggle back to the server console.
-
Type dstrace file off at the server console.
This stops capture trace messages to the log file. It also stops logging the information into the file.
-
Open the dstrace.log in a text editor and search for the event or the object you modified.
Windows
-
Open the > > dstrace.dlm, then click to display the NDS Server Trace utility window.
-
Click > , then click to clear all of the default flags.
-
Select and .
-
Click OK.
-
Click .
-
Specify the filename and location where you want the DSTRACE information saved, then click .
-
Wait for the event to occur.
-
Click .
This stops the information from being written to the log file.
-
Open the file in a text editor and search for the event or the object you modified.
UNIX
-
Enter ndstrace to start the ndstrace utility.
-
Enter set ndstrace=nodebug to turn off all trace flags currently set.
-
Enter set ndstrace on to display trace messages to the console.
-
Enter set ndstrace file on to capture trace messages to the file ndstrace.log to the directory where eDirectory is installed. By default it is /var/nds.
-
Enter set ndstrace=+dxml to display the Identity Manager events.
-
Enter set ndstrace=+dvrs to display the Identity Manager driver events.
-
Wait for the event to occur.
-
Enter set ndstrace file off to stop the logging of information to file.
-
Enter exit to quite the ndstrace utility.
-
Open the file in a text editor. Search for the event or the object that was modified.
iMonitor
iMonitor allows you to get DSTRACE information from a Web browser. It does not matter where Identity Manager is running. The following files run iMonitor:
-
ndsimon.nlm runs on NetWare®.
-
ndsimon.dlm runs on Windows.
-
ndsimonitor runs on UNIX.
-
Access iMonitor from http:// server_ip:8008/nds.
Port 8008 is the default.
-
Specify a username and password with administrative rights, then click .
-
Select on the left side.
-
Click .
-
Select and .
-
Click .
-
Select on the left side.
-
Click the document with the Modification Time of Current to see a live trace.
-
Change the if you want to see information more often.
-
Select on the left side, then click to turn the tracing off.
-
Select to view the trace history.
The files are distinguished by their time stamp.
If you need a copy of the HTML file, the default location is:
-
NetWare: sys:\system\ndsimon\dstrace*.htm
-
Windows: Drive_letter:\novell\nds\ndsimon\dstrace\*.htm
-
UNIX: /var/nds/dstrace/*.htm