3.2 Ganglia Appliance Monitoring
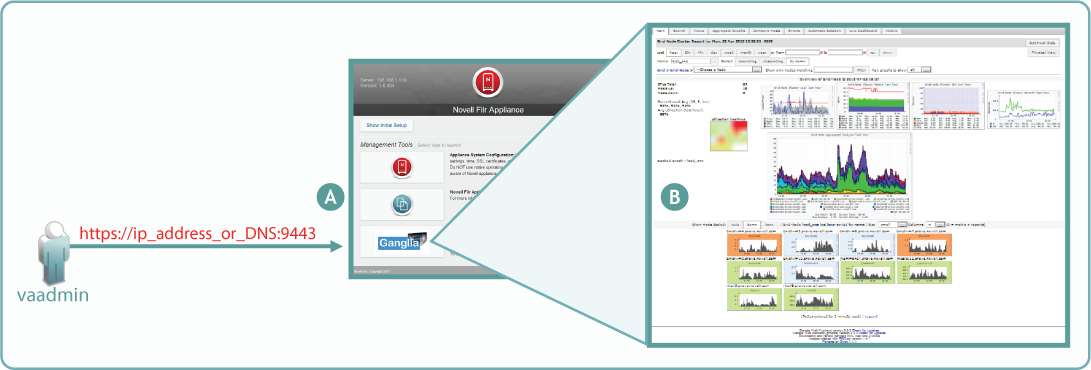
By launching the Ganglia monitoring page, as shown in Figure 3-2, you can access various real-time monitoring statistics for all of the Ganglia-enabled machines on your network segment.
Figure 3-2 Ganglia Appliance Monitoring
|
Letter |
Details |
|---|---|

|
The vaadmin administrative user has access to Ganglia monitoring, via the Appliance Configuration and Maintenance Web page. |

|
At the top of the Ganglia Web page are graphs that represent an aggregation of all of the Ganglia-enabled machines that are being monitored on your network segment. At the bottom of the page are graphs for each machine that is being monitored. By clicking an individual machine’s graph, you can get its details. For example, on a Filr appliance you see Filr metrics, /vastorage monitoring, CPU load, disk statistics, memory usage, and all of the standard Ganglia metrics. |
If you want to learn more about using and customizing Ganglia, you might consider investing in publications on the subject, such as the book Monitoring with Ganglia, which was written by developers and others associated with the Ganglia project.