15.5 Monitoring the Health of an Identity Server
15.5.1 Health States
The Health page displays the current status of the server. The following states are possible:
|
Icon |
Description |
|---|---|

|
A green status indicates that the server has not detected any problems |
|
|
A green status with a yellow diamond indicates that the server has not detected any problems but the configuration isn’t completely up-to-date because commands are pending. |
|
|
A green status with a red x indicates that the server has not detected any problems but that the configuration might not be what you want because one or more commands have failed. |

|
A red status with a bar indicates that the server has been stopped. |

|
A white status with disconnected bars indicates that the server is not communicating with the Administration Console. |
|
|
A yellow status indicates that the server might be functioning sub-optimally because of configuration discrepancies. |
|
|
A yellow status with a question mark indicates that the server has not been configured. |

|
A red status with an x indicates that the server configuration might be incomplete or wrong, that a dependent service in not running or functional, or that the server is having a runtime problem. |
15.5.2 Viewing the Health Details of an Identity Server
To view detailed health status information for an Identity Server:
-
In the Administration Console, click > > > .

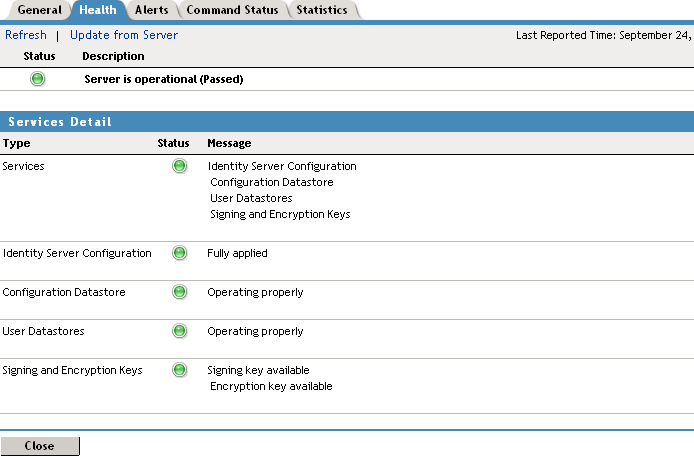
The status icon is followed by a description that explains the significance of the current state. For more information about the icons, see Section 15.5.1, Health States.
-
To ensure that the information is current, select one of the following:
-
Click to refresh the page with the latest health available from the Administration Console.
-
Click to send a request to the Identity Server to update its status information. This can take a few minutes.
-
-
Examine the section that displays the status of each service. For an Identity Server, this includes information such as the following:
Status Category
If not healthy
Status: Indicates whether the Identity Server is online and operational.
Verify whether the Identity Server has been stopped or is not configured.
Also verify that network problems are not interfering with communications between the Identity Server and the Administration Console.
Services: Indicates the general health of all configured services.
If one service is unhealthy, this category reflects that status. See the particular service that also displays an unhealthy status.
Identity Server Configuration: Indicates the status of the configuration.
Configure the Identity Server or assign the server to a configuration. See Section 1.0, Configuring an Identity Server.
Configuration Datastore: Indicates the status of the installed configuration datastore.
You might need to restart Tomcat or reinstall the Administration Console.
If you have a backup Administration Console, you can restore it. See
Backing Up and Restoring
in the NetIQ Access Manager 3.1 SP5 Administration Console Guide.If you don’t have a backup, you can try repairing the configuration datastore. See
Repairing the Configuration Datastore
in the NetIQ Access Manager 3.1 SP5 Administration Console Guide.If you want to convert a secondary console to your primary console, see
Converting a Secondary Console into a Primary Console
in the NetIQ Access Manager 3.1 SP5 Administration Console Guide.User Datastores: Indicates whether the Identity Server can communicate with the user stores, authenticate as the admin user, and find the search context.
Ensure that the user store is operating and configured correctly. You might need to import the SSL certificate for communication with the Identity Server. See Section 3.1, Configuring Identity User Stores.
Signing, Encryption and SSL Connector Keys: Indicates whether these keystores contain valid a key.
Click > > and replace any missing or expired keys.
System Incoming and Outgoing HTTP Requests: Appears when throughput is slow. This health check monitors incoming HTTP requests, outgoing HTTP requests on the SOAP back channel, and HTTP proxy requests to cluster members. If one or more requests remain in the queue for over 2 minutes, this health check appears.
Verify that all members of the cluster have sufficient bandwidth to handle requests. If a cluster member is going down, the problem resolves itself as other members of the cluster are informed that the member is down.
If a cluster member is slow because it doesn’t have enough physical resources (speed or memory) to handle the load, upgrade the hardware.
SSL Communication: Indicates whether SSL communication is operating correctly. This health check appears only when the SSL communication check fails.
Check SSL connectivity. Check for expired SSL certificates.
Audit Logging Server: Indicates whether the audit agent is functioning and able to log events to the auditing server.
Auditing must be enabled on the Identity Server to activate this health check (click > > > ).
Check the network connection between the Identity Server and the auditing server.
-
Click .
15.5.3 Viewing the Health Details of a Cluster
The health page displays the current health of the cluster.
-
In the Administration Console, click > > > .

The status icon is followed by a description that explains the significance of the current state. For more information about the icons, see Section 15.5.1, Health States.
-
To ensure that the information is current, click to refresh the page with the latest health available from the Administration Console.
-
To view health details about a specific member of the cluster, click the server’s health icon.