26.1 Viewing Statistics of SSL VPN Server
-
In the Administration Console, click > [Server Name] > .
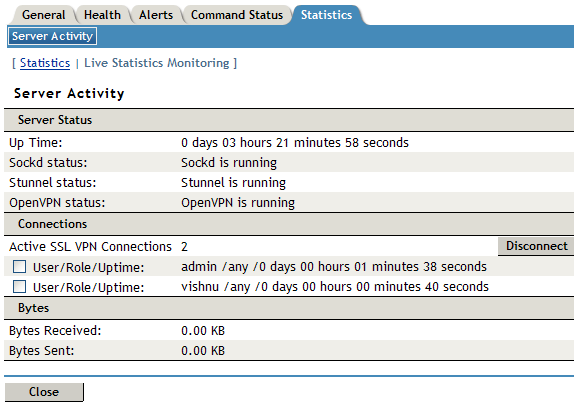
The Server Statistics page is displayed.

Server Status information is gathered in the following sections:
Connection information is gathered in the following sections:
Column
Description
Active SSL VPN Connections
Displays the number of active SSL VPN connections. The username, role of the user, and uptime of each user for each active connection.
Bytes information is gathered in the following sections:
Column
Description
Bytes Received
Displays the number of bytes received. You can also view a graph, which lists the number of bytes sent for fixed intervals. For more information, see Section 26.3, Viewing the Bytes Graphs.
Bytes Sent
Displays the number of bytes sent. You can also view a graph, which lists the number of bytes sent for fixed intervals. For more information, see Section 26.3, Viewing the Bytes Graphs.
Received Byte Rate
Displays the percentage of bytes received.
Sent Byte Rate
Displays the percentage of bytes sent.
Total Byte Rate
Displays the total percentage of bytes transferred.
-
Select one of the following options:
-
Statistics: To display the number of active client connections and the time when the server was started, click .
-
Live Statistics Monitoring: To refresh the above information for a specified interval, click . You can select the refresh interval from the drop-down list.
-
-
Click to close the tab.