6.1 Configuring Syslog Data Collection
The Sentinel Log Manager is preconfigured to accept syslog data from syslog event sources that are sending data over TCP (port 1468), UDP (port 1514), or SSL (port 1443). Additionally, if your firewall is enabled and supports iptables, Sentinel Log Manager automatically forwards events to UDP port 514 to port 1514.
To get started with syslog data collection, configure your syslog event sources to send their data to one of these ports. When Sentinel Log Manager receives data from your event sources, it automatically chooses the best collector to parse the data, parses the data into events, and stores the event and raw data in the configured archived location. You can also configure Sentinel Log Manager to listen on additional ports.
The following sections describe how you can configure the event sources to send data to the Sentinel Log Manager and how you can configure new syslog ports to receive data:
6.1.1 Managing Syslog Event Sources
When you point your syslog event sources to Sentinel Log Manager, it automatically creates an event source entry to track data that is being received from the event source and to allow you to manage how the data is processed. An entry is created for each unique IP address or hostname that appears in the header portion of the syslog messages. This entry enables you to identify the machines that are generating the syslog messages, regardless of whether they are being aggregated by a syslog relay or not. The user interface also displays the health of the event source as well as the volume of data being received from it in events per second.
This section describes how to view the event sources that are sending Sentinel Log Manager data and how to configure the data processing.
-
Log in to the Sentinel Log Manager as an administrator.
-
Click the link in the upper left corner of the page.
-
The tab is displayed on the right pane of the page.
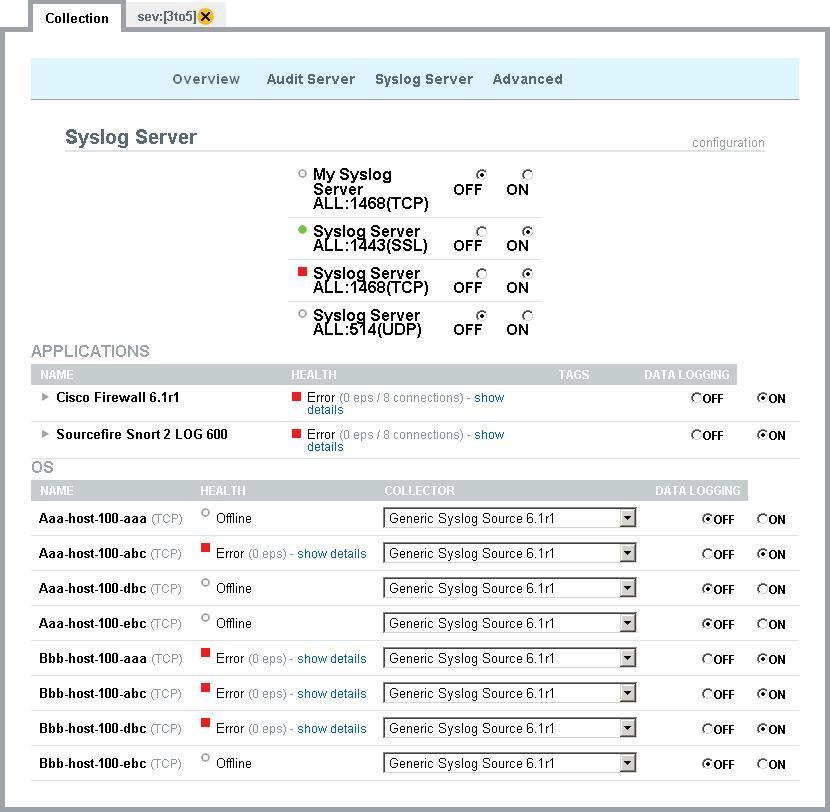
The section displays a list of syslog servers configured to listen for syslog messages. Each syslog server is listening on a single port. All syslog servers within the Sentinel Log Manager system are listed here, even if the server is configured on a remote Collector Manager. In addition to turning the server on or off (which starts or stops the server from listening on the port), you can also view the health of the server. The colored icon next to the syslog server indicates its health.
Green: Indicates that the syslog server is healthy (it is turned on, is listening on a port, and does not have any unresolved errors).
Red: Indicates that the syslog server is experiencing errors but still running. In this state, the syslog server may not be able to process some or all of the data it is receiving. On clicking the link, the reason for the error is displayed.
Gray: Indicates that the syslog server is turned off.
Orange: Indicates that the syslog server is running with some warnings. In this state, the syslog server is still processing the received syslog messages.
-
Click the tab.
-
In the section, you can enable or disable data collection for each of the syslog server ports by using the on or off options next to them.
NOTE:The application event source and operating system event source tables appear only if any event sources are connected to Novell Sentinel Log Manager.
The event sources are categorized as either an application or an operation system. The categorization is primarily determined by the collector to which the event source is attached. If the event source is attached to a collector that specifies application IDs in its connection mode properties, the event source is placed in the applications category. Event sources in the applications category are processing data from very specific applications.
If the event source is attached to a collector that specifies a UniqueMatchineRule or UniversalSyslogCollector in its connection mode properties, the event source is placed in the operating system category. Event sources in the operating system category are processing everything that is left over after all the application specific data is sent to the event sources in the applications category.
Some of the messages that are processed by an event source in the operating systems category are sshd, kernel, su, login, etc.
For more information on the connection mode properties that affect the categorization of event sources, see Section F.0, Syslog Collector Package Policy.
-
Application Event Source: The Application event source table shows the list of applications that are sending syslog data to Sentinel Log Manager. For each application, you can view the individual event source that is sending the data by clicking on the application name. The following table explains each column of the application event source table.
-
Operating System Event Source: Each row of the Operating System Event Source table gives information about the event sources along with their associated Collector name in a drop-down list. The following table explains each column of the operating system event source table:
-
Changes on this page take immediate effect.
NOTE:The Syslog Server page shows event sources that were already configured or automatically detected. To manually configure additional event sources, use the Event Source Management user interface described in the Launching the Event Source Management.
6.1.2 Configuring Syslog Servers
The Sentinel Log Manager web interface allows you to configure ports to listens on to receive syslog data.
To add or remove syslog servers, use the Event Source Management interface. For more information, see Launching the Event Source Management.
This section describes how to change the port, a syslog server listens on and how to configure the type of client and sever authentication for syslog servers that uses SSL.
Specifying the Syslog Server Settings
-
Log in to the Sentinel Log Manager as an administrator.
-
Click the link in the upper left corner of the page.
The tab is displayed on the right pane of the page.
-
Select the tab.
-
Click the link on the right side of the screen.
The screen is displayed.
-
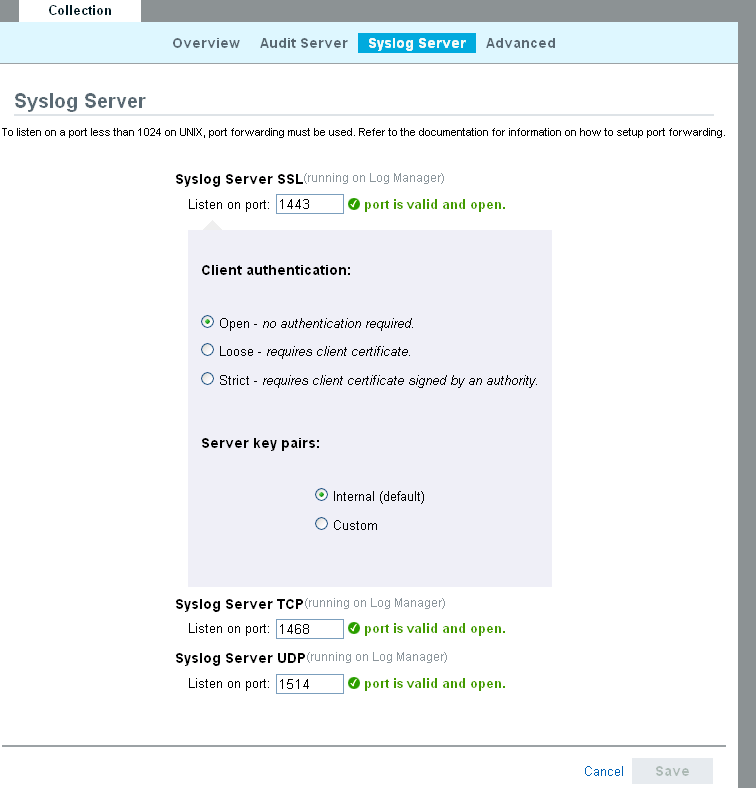
Specify the TCP, UDP, and SSL port numbers for the syslog servers.
The default ports for TCP, UDP, and SSL are 1468, 1514, and 1443 respectively.
-
To change the port values, specify a valid port value. The following table shows the description of the status messages you get after entering the valid or non-valid port values.
-
Set the appropriate client authentication and server key pairs settings for the SSL Syslog server. For more information on setting the client authentication, see Configuring Client Authentication for the SSL Syslog Server.
-
Click .
The button is disabled until a valid port is specified for all the servers.
Configuring Client Authentication for the SSL Syslog Server
The client authentication settings determine how strictly the SSL syslog server verifies the identity of syslog event sources attempting to send their data. Use a strict client authentication policy that is applicable in your environment to prevent rogue syslog event sources from sending undesired data into the Sentinel Log Manager.
Open: No authentication is required. Log Manager does not request, require, or validate a certificate from the event source.
Loose: A valid X.509 certificate is required from the event source, but the certificate is not validated. It does not need to be signed by a certificate authority.
Strict: A valid X.509 certificate is required from the event source, and it must be signed by a trusted certificate authority. If the event source does not present a valid certificate, Log Manager does not accept its event data.
Creating a Truststore
For strict authentication, you must have a truststore that contains either the certificate of the event source or the certificate of the certificate authority (CA) that signed the event source certificate. After you have a DER or PEM certificate, you can create the truststore by using the CreateTruststore utility that comes with Log Manager.
-
Log in to the Sentinel Log Manager server as novell.
-
Go to /opt/novell/sentinel_log_mgr_1.0_x86/data/updates/done.
-
To extract the syslog_connector.zip file.
unzip syslog_connector.zip
-
Either copy the TruststoreCreator.sh or TruststoreCreator.bat file to the machine with the certificates or copy the certificates to the machine with the TruststoreCreator utility.
-
Run the TruststoreCreator.sh utility.
TruststoreCreator.sh -keystore /tmp/my.keystore -password password1 -certs /tmp/cert1.pem,/tmp/cert2.pem
In this example, the TruststoreCreator utility creates a keystore file called my.keystore that contains two certificates (cert1.pem and cert2.pem). It is protected by the password password1. The keystore file must be imported into the truststore.
Importing a Truststore
For strict authentication, the administrator can import a truststore by using the button. This helps ensure that only authorized event sources are sending data to Log Manager. The truststore must include either the event source certificate or the certificate of the certificate authority that signed it.
The following procedure must be run on the machine that has the truststore on it. You can open a Web browser on the machine with the truststore or move the truststore to any machine with a Web browser.
To import a truststore:
-
Log in to the Sentinel Log Manager as an administrator.
-
Click the link at the upper left corner of the page.
The tab is displayed on the right pane of the page.
-
Click the tab.
-
Click the link on the right side of the screen.
-
Select the option under .
-
Click and browse to the truststore file (for example, my.keystore)
-
Specify the password for the truststore file.
-
Click .
-
If desired, click to see more information about the truststore.
-
Click .
After the truststore is imported successfully, you can click to see the certificates included in the truststore.
Server Key Pair
The Sentinel Log Manager is installed with a built-in certificate, used to authenticate the Sentinel Log Manager server to the event sources. This certificate can be overridden with a certificate signed by a public certificate authority (CA).
To replace the built-in certificate:
-
Log in to the Sentinel Log Manager as an administrator.
-
Click the link at the upper left corner of the page.
The tab is displayed on the right pane of the page.
-
Select the tab.
-
Click the link on the right side of the screen.
-
Under, select .
-
Click and browse to the truststore file.
-
Specify the password for the truststore file.
-
Click .
If there is more than one public-private key pair associated with the file, select the desired key pair, and click .
-
Click to see more information about the server key pair.
-
Click .
Listening on Ports Below 1024
NOTE:The instructions in this section assume that your firewall is enabled and is compatible with the iptables command. If this is not the case, there are likely options in your firewall configuration interface to allow you to configure the same port forwarding as described here.
As Sentinel Log Manager runs as the novell user, it cannot directly listen on ports that are less than 1024. To listen on a port that is less than 1024, use port forwarding to forward data to a port that Sentinel Log Manager can directly listen on. Sentinel Log Manager comes with the Install_Directory/bin/config_firewall.sh script to assist you in getting port forwarding setup. This script contains an example command of forwarding UDP port 514 to port 1514. This script is automatically run every time Sentinel Log Manager service startup /etc/init.d/sentinel_log_mgr script is executed with the start option by the root user.
You must run the following port forwarding command as root:
iptables -t nat -A PREROUTING -p <protocol> --destination-port <incoming port> -j REDIRECT --to-ports
The following command is an example of how to forward events from the default syslog server port 514 to the Novell Sentinel Log Manager port 1514 for Syslog UDP traffic:
iptables -t nat -A PREROUTING -p udp --destination-port 514 -j REDIRECT --to-ports 1514