6.4 Viewing Events Per Second Statistics
6.4.1 Viewing Graphical Representation of Events Per Second Value
-
Log in to the Sentinel Log Manager as an administrator.
-
Click the link in the upper left corner of the page.
-
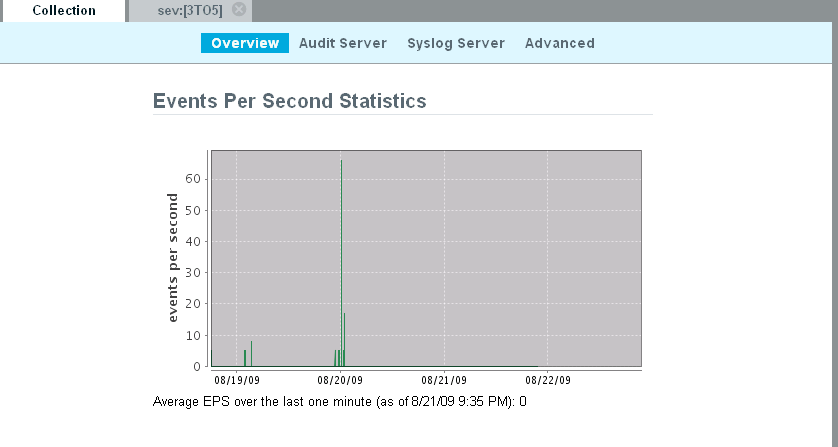
The tab is displayed on the right pane of the page.
-
In the section, you can view events per second value of the incoming events in the last one minute.
The graph shows the last 90 day statistics of all the events coming to the Sentinel Log Manager server.
6.4.2 Viewing Events Per Second on Syslog Server
-
Log in to the Sentinel Log Manager as an administrator.
-
Click the link in the upper left corner of the page.
-
The tab is displayed on the right pane of the page.
-
In the S table, the column shows the events per second (eps) value for the collector. It also shows the number of connections contributed by the event sources.
-
In the table, the event sources are shown individually and are not grouped under the collectors. To know the eps value for the collectors listed in the table perform the following steps.
-
Go to the tab and launch the Event Source Management window.
For more information about how to launch the Event Source Management window, see Launching the Event Source Management.
-
Select the collector node.
-
View the details of the events sent in last interval and the length of the interval for the collector in the column on the bottom-right pane of the Event Source Management window.
-
6.4.3 Viewing Events Per Second on Audit Server
-
Log in to the Sentinel Log Manager as an administrator.
-
Click the link in the upper left corner of the page.
-
The tab is displayed on the right pane of the page.
-
In the column, you can view the events per second value received by the collector.