5.1 Monitoring Server Health
Monitoring the health of your server can help prevent it from getting to a state in which your users cannot access the server or the data on it. Monitoring your server's health involves the following tasks:
5.1.1 Monitoring Overall Server Health or the Health of a Specific Item
Using Novell Remote Manager, you can monitor the server's overall health and the health of specific items on the server.
The server's overall health is indicated by the color of the circle displayed next to the icon  in the header frame for Novell Remote Manager. The following table lists and explains each health status that might be displayed.
Table 5-1 Overall Server Health Status Explanation


The server's overall health is determined by items that are selected in the list on the detailed Health Monitor page. By default, all items are checked.
Therefore, if you have a server that has specific parameters that you know will cause a suspect or bad status and you want to be notified when other parameters have changed, you can remove the suspect or bad parameters from the and lists by deselecting them and clicking on the Health Monitor page.
If the status of any item that is selected in the list changes to yellow (suspect) or red (bad), the health status indicator light on the header frame changes to indicate there is a problem. If more than one item changes, the worst status indicates the server's overall status. When the status for all items returns to green (good), then the health light indicator changes back to green (good).
The server's health status, reported by the health status indicator, is updated every five seconds, but the graphic refreshes only if the status changes.
You can also view the changes of status in the Server Health Log. For more information, see Viewing and Managing Server Logs.
The Health Monitor page shows the health status (green, good; yellow, suspect; or red, bad) for all known components of the system, as well as current, peak, and maximum values. When an item is not selected in the column, it is not included when determining the overall server health and the values for Status, Current, Peak, and Max are not displayed.
Figure 5-1 Health Monitor Page
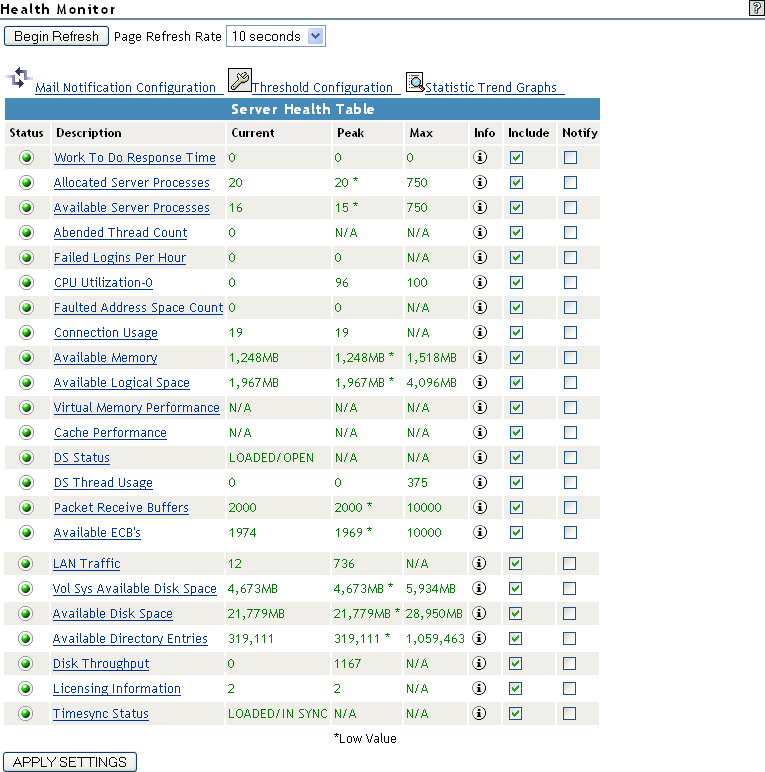
The following items are key indicators of your server's health:
-
-
-
-
(if the server has abended and recovered automatically)
-
-
(for each processor, if there is more than one)
-
-
-
-
-
-
-
-
-
-
-
-
-
-
-
You can change the thresholds for the and values of these indicators individually or restore the defaults for all these parameters at one time. See Configuring Health Thresholds.
Additional items are tracked on the Health Monitor page and are displayed depending on the NLM™ programs that are loaded on the server.
To access the Health Monitor page, click one of the following links in Novell Remote Manager:
-
icon.
-
 icon in the header frame
-
link in the navigation frame under the heading.
5.1.2 Configuring Health Thresholds
If you have a server that runs differently than normal, you can configure the and threshold values for to something other than the default or change the amount of time before the trigger occurs. After changing setting, you can also restore all settings to the default values. For procedures, see the following:
Changing Criteria for Suspect or Critical Health Indicators
To change the criteria for the suspect (yellow/suspect) and critical (red/bad), status indicators for a specific operation:
-
On the Health Monitor page, click , then click the name link for the item you want to change.
-
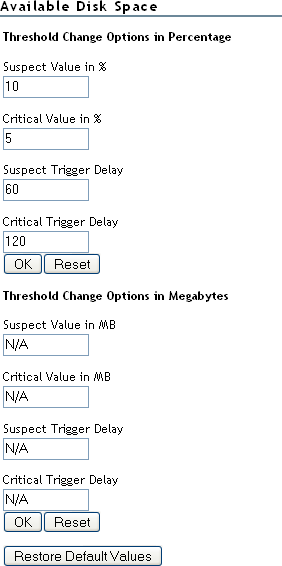
Specify the new or value, then click .
-
(Optional) If you want to change both the values back to the default setting, click , then click .
For example, on the Available Disk Space page, you can specify the settings in either a percentage or megabyte value.
Changing Suspect or Critical Status Indicator Triggers
To change the amount of time before a status change for the suspect (yellow/suspect) and critical (red/bad) status indicators for a specific operation:
-
On the Health Monitor page, click , then click the name link for the item you want to change.
-
Specify the new or trigger delay value, then click .
-
(Optional) If you want to change both the values back to the default setting, click , then click OK.
Restoring Settings
To restore all the settings to the default values after changing them, click Health Monitor > Threshold Configuration > Restore All Defaults.
5.1.3 Viewing Statistics Trend Graphs
The Statistics Trend Graphs let you select and create specific server statistics trend graphs for the statistics and duration listed. The graphs can cover from the last minute up to the total time the system has been up, depending on the duration you select.
IMPORTANT:Graphs ignore daylight savings time changes. For example, in the Spring when clocks are set ahead, the graphical statistics show a one hour gap at the hour where the server’s clock is reset to daylight savings time. Novell Remote Manager interprets the missing hour as down time.
After changing the server configuration or hardware, you can reset the data you gather.
All the graph data is saved to files in sys:system with a .tdf extension. These files use minimal disk space compared to the value they provide.
For information about the trends you notice and actions to take, see the online help.
Table 5-2 Tasks and Procedures for Viewing and Generating Server Statistics Trend Graphs
5.1.4 Configuring E-Mail Notification for Server Health Status
Rather than manually checking the server’s health status through Novell Remote Manager’s interface, you can configure Novell Remote Manager to send an e-mail to notify you when the server's health status changes to any value other than Green (good).
-
On the Health Monitor page, click the link.
-
Specify the required information on the Mail Notification Configuration page, then click .
A primary server and at least one user on the notification list is required.
If you want to configure the same information on several servers, create a group using the Group Operation procedures and then run the Synchronize E-mail Settings operation. For more information, see Building and Configuring a Monitoring Group and Performing Synchronizing Operations on Server Groups.
-
On the Health Monitor page, select the check box for each item you want notification for.
If you want to receive an abend log by e-mail when the server has abended, click the check box for the item on the Health Monitor page.
The e‑mail contains a default subject line: Server Health Warning.
If you want the subject line of the e-mail notification to contain information about the server, the specific health item the notification is for, and its status, do the following:
-
In the header frame of Novell Remote Manager, click the icon
 .
.
-
On the Novell Remote Manager Configuration Options page, click the option to toggle the status to .
Clicking the to toggle the status to returns the subject line for the e-mail notification to the default subject line.
-
5.1.5 Troubleshooting a Suspect or Bad Health Status
When the health status of an item changes from good to a suspect or bad state, you can look at the specific item and click the icon  for suggested remedies or click the link in the column for more detailed status and information about the health item.
-
Access the Health Monitor page.
-
Look for the specific health item that has changed status.
-
View the information for the item that has changed by clicking the icon
for the item.
This information outlines the specific health criteria (thresholds) for green, yellow, red or statuses in that component. It also provides suggestions in some cases for what might be going wrong in that component if a yellow or red indicator is displayed.
-
Perform the recommended or appropriate action for the health item that has changed.
-
In the column of the Server Health Table, you can also click the link for the applicable item to view more detail information tracked about the health item.
You can also use the Server Health Log to track the status of each health item that changes. For more information, see Viewing and Managing Server Logs.