5.14 Monitoring the NetWare Server
Monitoring the server allows you to do the following:
-
Isolate performance bottlenecks
-
Optimize server performance
-
Troubleshoot and resolve server problems
This section discusses several key tools included with NetWare that you can use to monitor the NetWare server.
5.14.1 Novell Remote Manager
Novell Remote Manager is a tool for debugging and monitoring the server from a Web browser at your workstation. You can also access a Java version of this tool from the server GUI. For more information, see Accessing Novell Remote Manager for NetWare
, Diagnosing Server Problems
, and Troubleshooting Specific Problems
in the NW 6.5 SP8: Novell Remote Manager Administration Guide.
5.14.2 Health Command
The Health command can be used at the server console to view the overall health of the server. If the overall health status for the server is something other than Good, you might want to use the All option with the Health command to view the health status of the specific component that might be causing the abnormal health status.
To use this command, the portal.nlm must be loaded on the server.
For more information, see Health
in the NW 6.5 SP8: Utilities Reference.
5.14.3 Monitor
Monitor is the key tool for performance monitoring at the server level from the server console. It runs in the NetWare kernel so that it can make calls directly to the operating system. Most statistics are updated every second.
This section includes the following information:
Accessing Monitor
-
To load Monitor at the System Console prompt, enter
[load] [path] monitor
The LOAD command is necessary only if you have a batch file with the same name as the NLM. (Using the LOAD command indicates that Monitor is a loadable module.)
The path is specified only if you moved the utility from its default directory sys:system to a directory that does not have a search path.
-
If Monitor is running but is not the active screen at the console, there are two ways to toggle to the Monitor screen:
-
Press Alt+Esc. To cycle through other console screens, continue to hold Alt down and tap Esc until the current Monitor screen reappears. Use the bar at the top of the screen for navigation.
-
Press Ctrl+Esc. To display a numbered list of available console screens, then enter the number for the NetWare Console Monitor.
-
-
To exit Monitor, use either of the following procedures:
Repeatedly press Esc until the Exit confirmation box appears. Then press Enter to return to the System Console prompt.
To immediately bring up the Exit confirmation box, press Alt+F10, then press Enter to return to the System Console prompt.
What to Monitor and Why
A monitoring utility can be overwhelming in the volume of information and statistics it provides.
To simplify your access to key parameters, Monitor's General Information screen includes most of them on one screen, including performance indicators that pertain to disk I/O and memory utilization.
For an explanation of the interaction of three types of configurable parameters that control dynamically allocated services, see Monitoring Allocated Services. The guidelines allow you to be proactive in maintaining the level of service your users require.
Other Information and Statistics to Monitor includes error logs, available free disk space, and user accounts. To be prepared for power supply interruptions, test your UPS (uninterruptable power system) periodically.
Becoming familiar with your server’s day-to-day performance and its characteristic response to its unique load will help you to better interpret the information and statistics that the monitoring utilities provide.
Monitor's General Information
Most of the important performance indicators that can be used to track, diagnose, and resolve server problems appear in the General Information screen in Monitor. The following screen is displayed when you load Monitor.
Figure 5-2 General Information Screen in Monitor
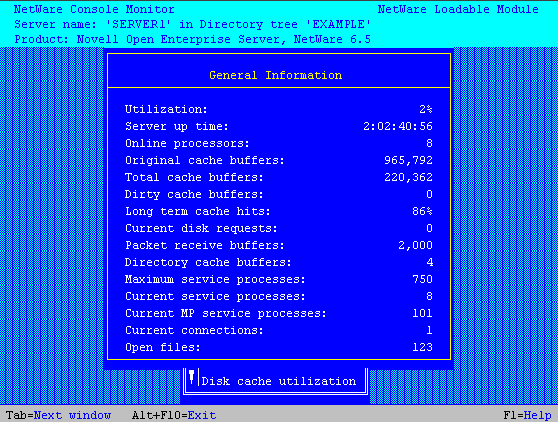
The following information describes the onscreen performance indicators.
-
Utilization. Average of the server’s total processing capacity that was used during the last e second, expressed as a percentage. The remainder of the time is spent in an idle loop.
Use this information to monitor the patterns of utilization.
Does utilization go to 100 percent? Does it reach a plateau or does it peak for a few seconds and then drop? What time and how frequently does it peak?
-
Server Up Time. Amount of time that has elapsed since the server was most recently started. If your server has Auto Restart enabled, use this field to determine whether your server has abended and restarted. You can also use this information to detect power failures or intruders who bring down the server.
-
Online Processors. Number of enabled and online processors. The Platform Support Module (PSM), loaded from startup.ncf, enables NetWare to use secondary processors in a multiprocessing platform. The default is to autostart all processors.
-
Total Cache Buffers. The amount of cache buffers are currently available for file caching. This number decreases as you load NLM programs.
Because file caching has a dramatic impact on server performance, you want this number to be as high as possible.
-
Dirty Cache Buffers. The amount of buffers contain data which has been changed but not yet written to disk.
Monitor this number to see whether it is increasing. If it is, you might have a bottleneck in the Traditional file system.
-
Long Term Cache Hits. The cumulative percentage of requests for disk blocks that were already in cache for the Traditional file system. (When the requested data is already in memory, disk reads don’t need to be made.)
Use this percentage to assess overall disk cache utilization if you are using the Traditional file system. If this value falls below 90%, the disk thrashes and server performance degrades. The solution is to install more physical memory (RAM).
-
Current Disk Requests. The amount of read requests are pending.
Monitor this number to see whether it is increasing. If it is, a slow hard disk might be your bottleneck.
-
Packet Receive Buffers. The amount of memory that is allocated for holding client requests while the server processes them. The server allocates more packet receive buffers as needed (within minimum and maximum values). Buffer size depends on the network adapter.
This number is the result of the interaction of three configurable parameters. Monitor the current value to ensure that it does not reach the maximum value.
-
Maximum Service Processes. The amount of task handlers that the server can allocate to service client requests. As the number of client requests increases, the server creates more service processes. When no more service processes can be allocated, server performance is adversely affected.
Monitor the current number of service processes to ensure that it does not reach this value.
-
Current Service Processes. The amount of task handlers that are currently being used to service client requests.
Use this number to determine whether the server has enough free task handlers to service client requests. If the number of current service processes reaches the maximum, the value of the Maximum Service Processes (Communications category) parameter must be increased.
-
Current Connections. Number of active connections, whether licensed or unlicensed, authenticated or Not-Logged-In.
-
Open Files. Number of files currently being accessed by the server and by other clients. Certain files are always open, such as the hidden files that support eDirectory.
Monitoring Allocated Services
There are limits to resources in every computing environment. NetWare allocates resources according to need and availability. When a request is received, the operating system doesn’t immediately allocate new resources. It waits a specified amount of time to see if existing resources become available to service the demand.
Dynamically allocated services are controlled by the interaction of three types of settable parameters. If you understand how they work together, you can interpret the statistics that you monitor and know how to configure the system’s response to demand.
-
Maximum limits control the amount of server resources the operating system can allocate for a particular service.
-
Minimum limits allow the operating system to allocate a minimum amount of resources as soon as a request is received.
Low minimum limits slow the growth of a particular service. High minimum limits allow rapid growth.
-
Wait time limits control how rapidly the operating system can allocate a new resource.
If resources become available, no new resources are allocated. If they don’t become available within the time limit, new resources are allocated. The time limit ensures that sudden, infrequent peaks of server activity don’t permanently allocate unneeded resources.
Consider, for example, the allocation of directory cache buffers. If the minimum number of directory cache buffers is set to 20, the system allocates another buffer resource as soon as a request is made—until 20 cache buffers have been allocated.
When 20 directory cache buffers are allocated, the system waits 2.2 seconds (default) after a request comes in, and then allocates another buffer if the request is still active.
However, if the minimum number of directory cache buffers is set to 40, the system allocates 40 directory cache buffers before it starts slowing the growth by waiting 2.2 seconds after each request.
Other Information and Statistics to Monitor
Common maintenance tasks also include the following: