3.3 First Run Actions in the VM Management Interface
After you have logged into the VM Management, you can begin to build VMs by using the VM Builder, check those VMs into the warehouse, check-out and modify the VMs, and use the VM Management interface to its full capacity as an incredible resource in managing your VMs. For more information on the VM Management interface, see Section 2.0, VM Management Interfaces. And for information on the VM Builder, VM Warehouse, and their functionality, see Section 4.0, Configuring Virtual Machines.
3.3.1 Logging In to the VM Management Interface
When you first run the VM Management interface, you can interact with the Welcome pages to find information about VM Management and the VM Management interface.
To open the VM Management interface:
-
Do one of the following:
-
If you have a Novell Virtual Machine Management icon on your desktop, double-click it.
-
(Linux only) To open the management interface using a command terminal, change to the /opt/novell/zenworks/vmmanagement/bin/ directory and enter the following command:
./run_nvmm.sh
-
-
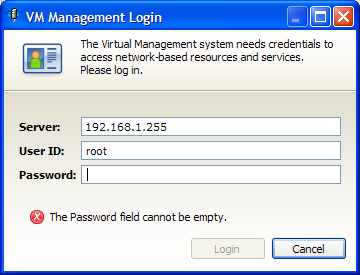
Close the Welcome pages to display the following login window:
-
Enter the IP address of the server running the VM Warehouse and VM Builder.
-
Enter a username and password with root privileges on the VM Warehouse/Builder server, then click .
If there is a version compatibility issue, the following dialog box is displayed:
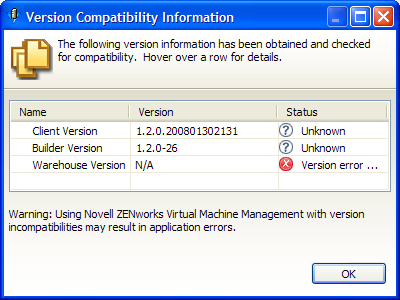
Review the data, click , then resolve the issue in order to use that server.
3.3.2 Logging In to ZENworks Orchestrator Monitoring
To monitor the managed nodes in your data center by using the VM Management interface:
-
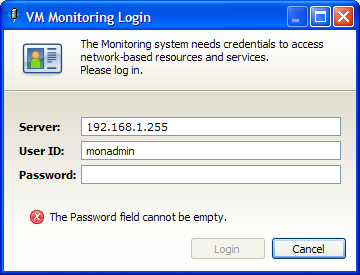
In the VM Management interface, click the button to change to the monitoring perspective to display the following dialog box:
-
Enter the monitoring username you created during the configuration of the Orchestrator Server.
After you log in, you can set your time constraint and see all the metrics that the Monitoring Service tracks in either a graphical or text-based form. For more information on what you can do with the Monitoring Service, see Section 5.2, Monitoring Virtual Machines.