2.1 The VM Management Interface
The VM Management interface is an Eclipse-based rich client interface that allows you to use the VM Builder and the VM Warehouse.
2.1.1 Launching the ZENworks Orchestrator Console
You can do this from either the VM Warehouse/Builder server, or from a workstation:
From the VM Warehouse/Builder server
-
Open a command terminal.
-
Change to the /opt/novell/zenworks/zos/server/bin/ directory.
-
Enter $./zoc.
-
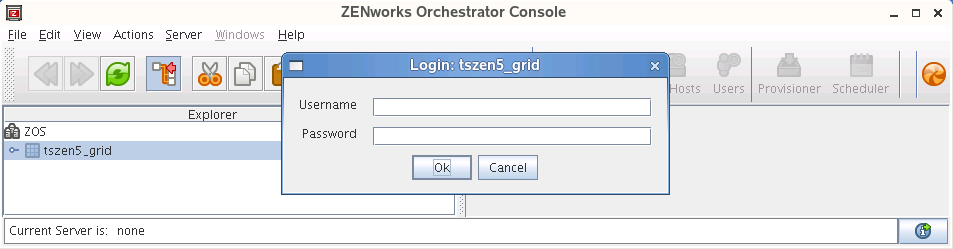
When the Orchestrator Console opens, click on your grid in the tree view.
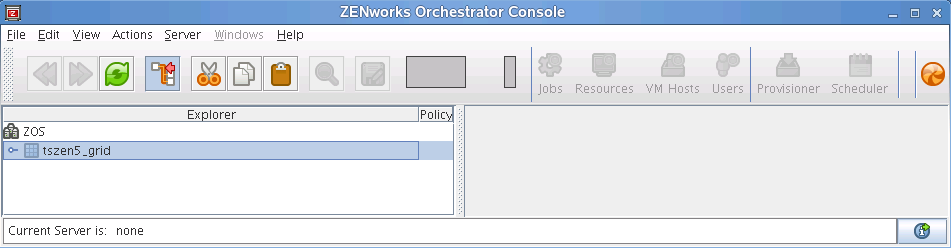
-
Enter your ZENworks Orchestrator Console administrator username and password.
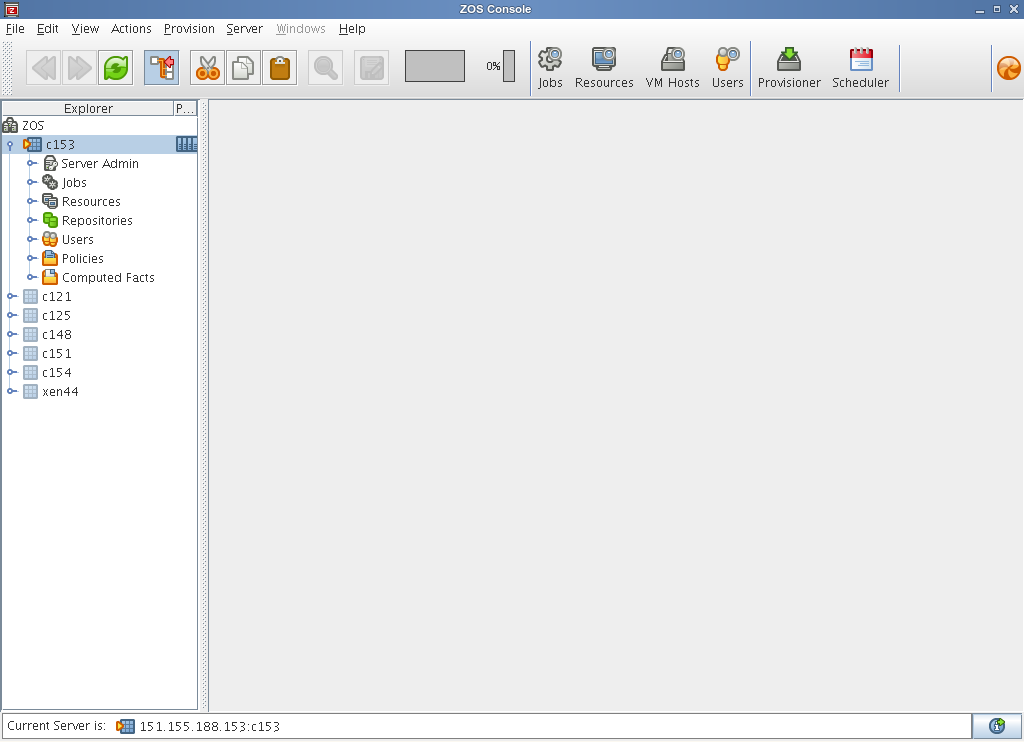
The tree is expanded for your grid, as shown in this illustration:
From Your Workstation
-
Open a command terminal.
-
To connect to the VM Warehouse/Builder server, enter the following command:
ssh -X root@URLwhere URL is the URL of the server.
-
Log in with root privileges.
-
Change to the /opt/novell/zenworks/zos/server/bin/ directory and enter the following command:
./zoc
If you plan to also use this command terminal to open the VM Management interface, then instead enter:
./zoc &
-
When the Orchestrator Console opens, click on your grid in the tree view.
-
Enter your administrator username and password.
The tree is expanded for your grid, as shown in this illustration:
2.1.2 Launching the VM Management Interface
-
On your workstation, do one of the following:
-
If you installed the Novell Virtual Machine Management icon on your desktop, double-click it.
-
(Linux only) To use the command terminal, change to the /opt/novell/zenworks/vmmanagement/bin/ directory and enter the following command:
./run_nvmm.sh
-
-
Close the Welcome pages to display the following login window:
-
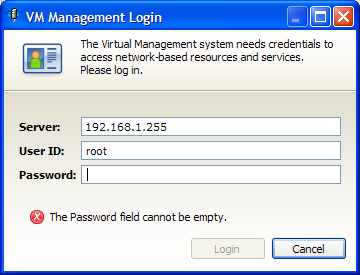
Enter the IP address of the server running the VM Warehouse and VM Builder.
-
Enter a username and password with root privileges on the VM Warehouse/Builder server, then click .
If there is a version compatibility issue, the following dialog box is displayed:
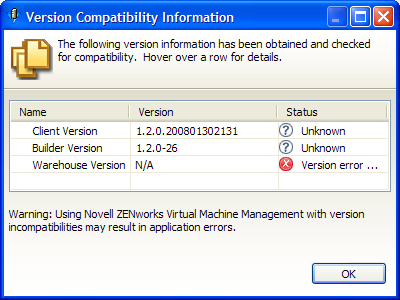
Review the data, click , then resolve the issue in order to use that server.
2.1.3 Introduction to the VM Management Interface
This section introduces you to the components of the GUI and gets you started managing your VMs in your data center. The GUI consists of the Welcome pages and two collections of Views called Perspectives.
VM Management Welcome Page
The first time you start ZENworks VM Management, the Welcome page displays. This page shows several buttons that take you to other pages containing more detailed information about the product.
Figure 2-1 VM Management Welcome Page
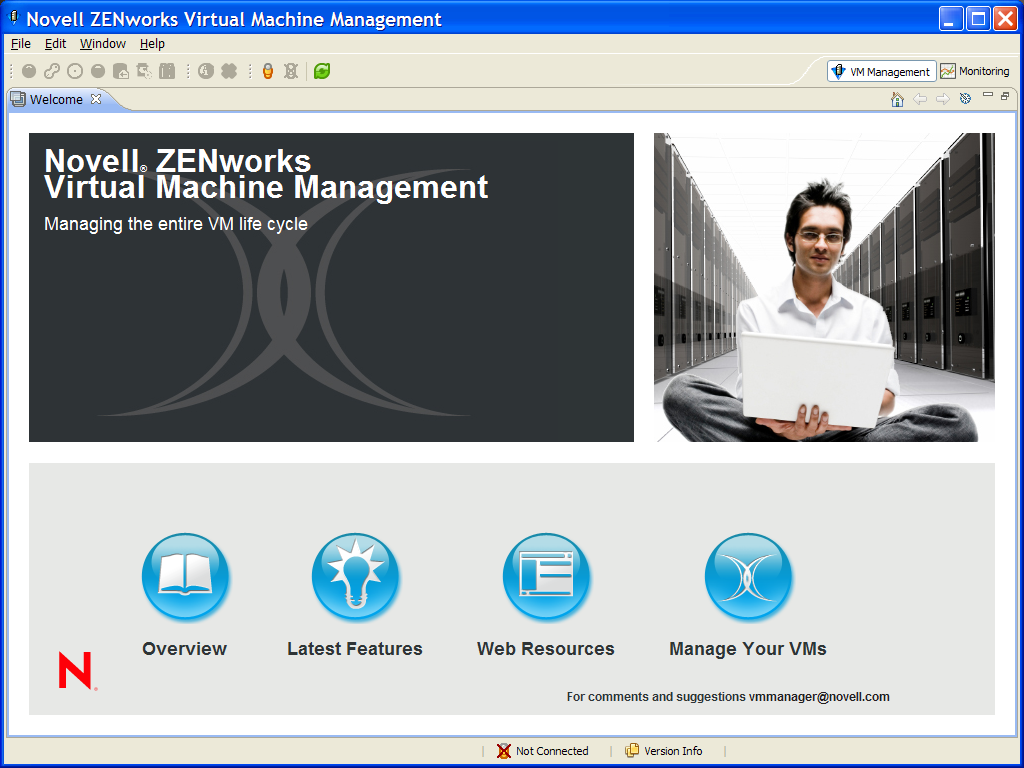
This home page of VM Management gives you quick access to answers for your questions concerning VM Management.
The Overview page contains links to a basic overview of VM Management, ZENworks Orchestrator Server and the VM life cycle.
The Latest Features page gives you links to new features and information about the product. Latest Features also highlights any improvements since the previous release of the software.
The Web Resources page gives you many different Web links to access various associated Web sites including product pages, information about Brainshare®, press releases, online documentation the VM Management and ZENworks Orchestrator Support, and other useful information.
launches the VM Management interface, where you can begin managing the VMs in your data center.
The welcome pages can be accessed again at any time by clicking > .
Basic VM Management Functionality
The ZENworks VM Management interface is designed to let you customize the overall look and feel of your interface. If you want to return to the initial perspective view, click > .
Moving and Resizing Views
To move a view, just drag it to a new location. As you drag, a black outline indicates its position that it will have when you release the mouse button. Use the window’s sizing handles to resize the view.
Combining Views
To combine (stack) any view window with another, drag the view to another view. A black box appears around the view you want to combine with. When you drop the view you are dragging, the views stack together, allowing you to switch between the two by clicking their titles.
Refreshing, Minimizing, and Maximizing Views
Click the two green arrows in a circle to refresh the view. Click the button to minimize the window. Click the button to expand the view to fill the entire interface window.
Popping Out a View
Drag a view outside the frame of the actual interface to have the view available in its own, separate window. In the Monitoring perspective, you can also click the icon to have the Monitoring editor window loaded in your default Internet browser.
Tips and Tricks
For further tips and tricks with operating the VM Management interface, see Section 2.3, Tips and Tricks with the VM Management Interface.
Virtual Machine Builder and Warehouse Perspective
After you close the Welcome pages, the VM Management perspective displays, as shown in the following figure. Click the button in the upper right corner of the interface to display the Monitoring perspective.
Figure 2-2 VM Management Perspective
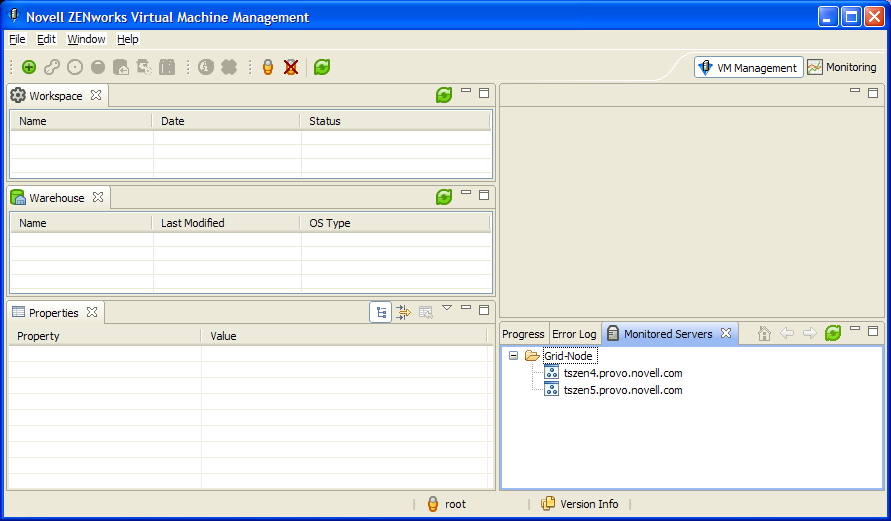
The VM Management perspective contains the Workspace view, VM Warehouse view, and the Properties view on the left side of the default perspective setup. The editor view space is the large section to the right.
Workspace View
The Workspace view is used to display VMs that can be edited. You can edit the VMs in the Workspace. The following figure represents an example of the Workspace view.
Figure 2-3 VM Management Workspace
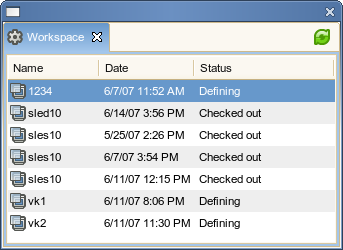
The Workspace provides access to the VM Builder and also lists VMs that have not been checked in or are in a checked out state copied from the Warehouse. You can build a new VM, edit the metadata attached to the VM, edit the VM image, and check in the VM to the VM Warehouse. The VM name, and creation or check-out date. These different states are:
-
Defining: Defining a VM is process of setting its parameters and constraints by adding the information in the VM Builder Wizard. For details on defining a VM, see Section 4.2.2, Defining the Virtual Machine.
-
Defined: A defined VM has had sufficient information added in the VM Builder Wizard but has not been created. The VM can be defined and closed, or you can keep the wizard open to begin installing the VM. You can also install a defined VM by right-clicking the defined VM, then clicking . Clicking opens the VM Builder Wizard again allowing you to click the button. For details on installing a Defined VM, see Section 4.2.3, Installing a Defined Virtual Machine.
-
Installing: A VM is installing when it is in the process of being built by the VM Builder. A VM in the process of being built will require you to be able to see it, with the initial installation. You can bring up a Virtual Network Computing (VNC) console icon to view and interact with its installation. You do not need a VNC connection to the VM if you are installing from an AutoYaST file. For details about the build process, see Section 2.3, Tips and Tricks with the VM Management Interface.
-
Installed: An installed VM has its build process complete and is ready to be launched to install any applications you need on the VM, including the Orchestrator Agent and the Monitoring Agent. When you are finished adding applications, you close the VM, and it is ready to be checked into the VM Warehouse. For details on adding applications to a newly built VM, see Section 4.2.5, Installing Applications on a Virtual Machine.
-
Checked Out: When a VM is checked out of the Warehouse for editing, modification, and application installation it is listed as . For information on checking out and modifying a VM, see Section 4.5, Modifying a Virtual Machine after Checking In.
-
Checking in: A VM is checking in when it is in the process of being returned the VM Warehouse for the next version iteration.
-
Check in Failed: The check-in failed.
Warehouse View
The Warehouse view shows all checked-in VMs, their names, most recent modification, and operating system type. The following figure represents the VM Warehouse with some checked in VMs.
Figure 2-4 VM Management Warehouse View
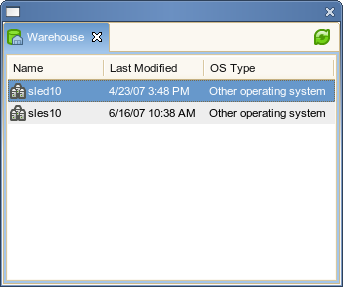
The Warehouse gives you information on:
-
Name: Gives the name of the collected group of VMs. This is the name that you gave in the VM Builder Wizard and is the name that shows up in the VM list in the Orchestrator Console.
-
Last Modified: Lists when the last version was modified and checked into the Warehouse.
-
OS Type: Indicates the type of operating system that was installed when the VM was created.
Properties View
The Properties view displays specific information and properties of a selected VM, whether selected from the Workspace or Warehouse view. The property is named and its description is given in the column. The following figure represents the Properties view.
Figure 2-5 VM Management Interface Properties View
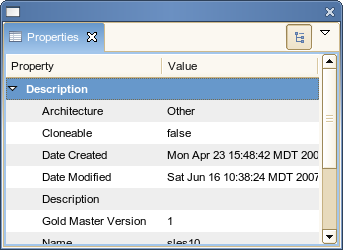
The available information for the Properties view changes depending on whether you select a VM in the Workspace or in the Warehouse. The properties of a VM in the Workspace are:
-
Description: Contains the information about the VM that make it unique or the initial parent of subsequent versions. This gets much of its information from user inputs and responses in the VM Builder Wizard.
-
Architecture: The type of virtual processor selected when the VM was built.
-
Cloneable: Indicates whether or not the VM can be cloned, if it is a template or a single version.
-
Date: Lists the date and time of the creation of, or last edit to, the VM.
-
Description: Notes the purpose and any other specifics you want to list for the VM. These notes apply to all versions of this VM.
-
Gold Master: Indicates if the VM is the Gold Master version that will be deployed by the Orchestrator Server for VM provisioning.
-
Location: Indicates if it is stored in the Warehouse or not.
-
Name: The name of the VM.
-
OS Type: Indicates the type of operating system that was installed when the VM was created.
-
Parent Version: Indicates which version was used to make the currently selected version of the VM.
-
Status: Displays the status or state of the VM. See Workspace View for a list of the types.
-
UUID: The unique identification of this specific instance and version of the VM. The VM is not given a UUID until it is launched for the first time.
-
Version: This indicates the current assigned version number of the VM, or the number it will be assigned when checked into the VM Warehouse.
-
VM Crash: This is the setting for what to do if the VM crashes. It defaults to Shutdown which means that if the VM crashes, it shuts down immediately.
-
VM Type: The virtualization type applied to the VM: paravirtualization or full virtualization. For more information on the virtualization type, see Virtualization Mode:.
-
-
Disks: The disks saved as part of the initial VM configuration are stored here. This section changes according to what kind and how many disks are saved as part of the VM metadata. The following are the types of disks that your VM can have:
-
Hard Disk: The non-saved hard disks used as normal hard disks after the VM launches. Any data on these disks is lost when you shutdown the VM. However, the disk size is maintained as part of the VM image.
-
CD-ROM/DVD: Gives access to any physical CD-ROM or DVD-ROM that is present on the VM host.
-
OS Disk: Lists the size of the first (and only) saved hard disk of the VM. This hard disk contains the installed guest operating system.
-
-
Hardware: Describes the virtualized hardware and architecture you earlier designated. Memory and graphics information is also included.
-
CPUs: The number of virtual processors you have assigned the VM.
-
CPU Weight: A numerical representation of the priority to access the VM host’s CPU.
-
Graphics: Lists the virtualized graphics card. If you have a paravirtualized guest operating system, this lists the card as paravirtualized, which means that the VM can directly access the graphics card of the host.
-
Memory: The range of allowable RAM the system can use while running.
-
VNC: Indicates if you can create a virtual network connection to the VM, allowing you to see and operate the VM at a graphical level.
-
-
Installation: Information about how the VM was installed, its source, and any other installation data.
-
Additional Args: Any listed additional arguments you made for the VM when you created it.
-
Auto Install File: The location of the AutoYaST file used for the installation of the VM.
-
Install Source: The location of the source files used to install the VM.
-
-
Misc: Any miscellaneous information about the VM, including usernames applied to the VM.
-
User: List the root user and any other users with access to the VM.
-
-
Network: Lists the network connection properties and virtualized network card properties.
-
Domain Name: This is the name of the domain to which the VM is assigned.
-
Host Name: This will usually be the name of your VM or it may be a host name you have designated during VM creation.
-
Paravirtualized: This section lists the parameters of the VM’s network card. If paravirtualized it will be listed in this state. It will default to Default MAC; DHCP IP Address. Although if a DHCP, DNS, or WINS specific property has been assigned, that information will display here.
-
Fully Virtualized: Lists the parameters of the network card attached to the VM including whether it is fully virtualized. For more information on the statuses assigned to the network settings, see Network.
-
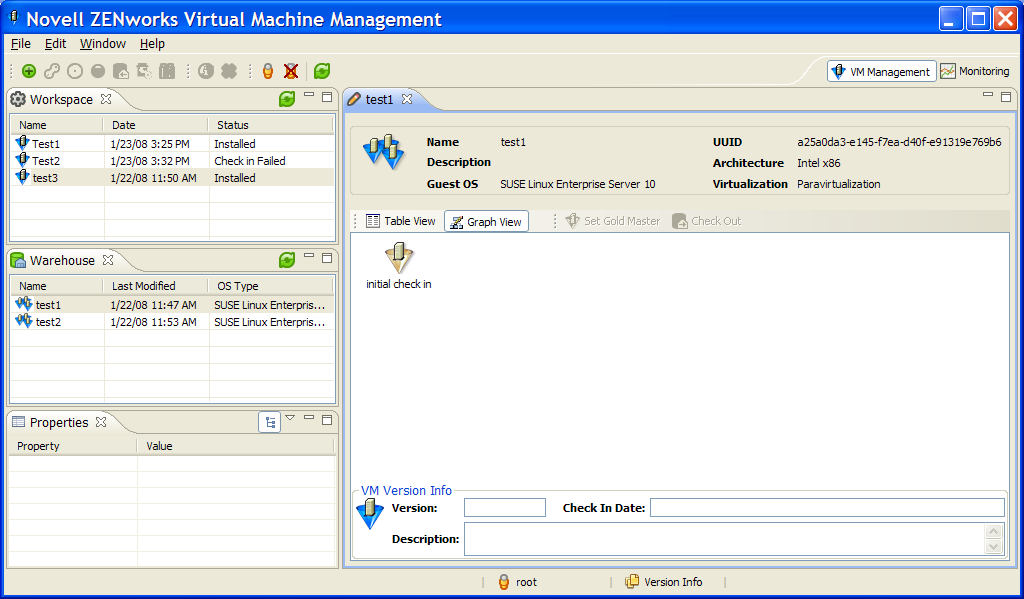
Showing Versions
Information about the VM and its history is available by:
-
Double-clicking the checked-in VM.
-
Right-clicking the checked-in VM and selecting .
-
Clicking the button at the top of the window.
This opens an edit window on the right of the initial structure with the following information:
-
Name: The name of the VM and its versions.
-
UUID: The unique identification of this instance of the VM.
-
Description: Any information you entered when you created this VM.
-
Architecture: The architecture of the virtualized processor.
-
OS Type: The type of operating system installed on the VM.
-
VM Type: Indicates whether the VM is fully virtualized or paravirtualized.
Figure 2-6 VM Information and Version Information, Table View
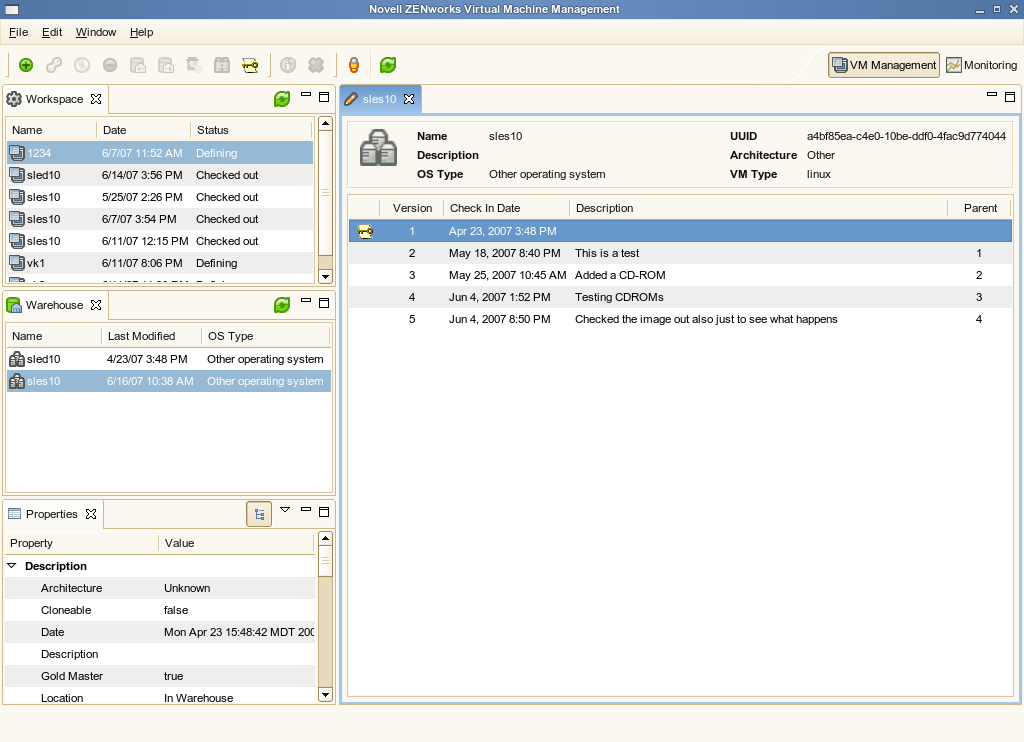
Figure 2-7 VM Information and Version Information, Graphical View
2.1.4 Monitoring Perspective
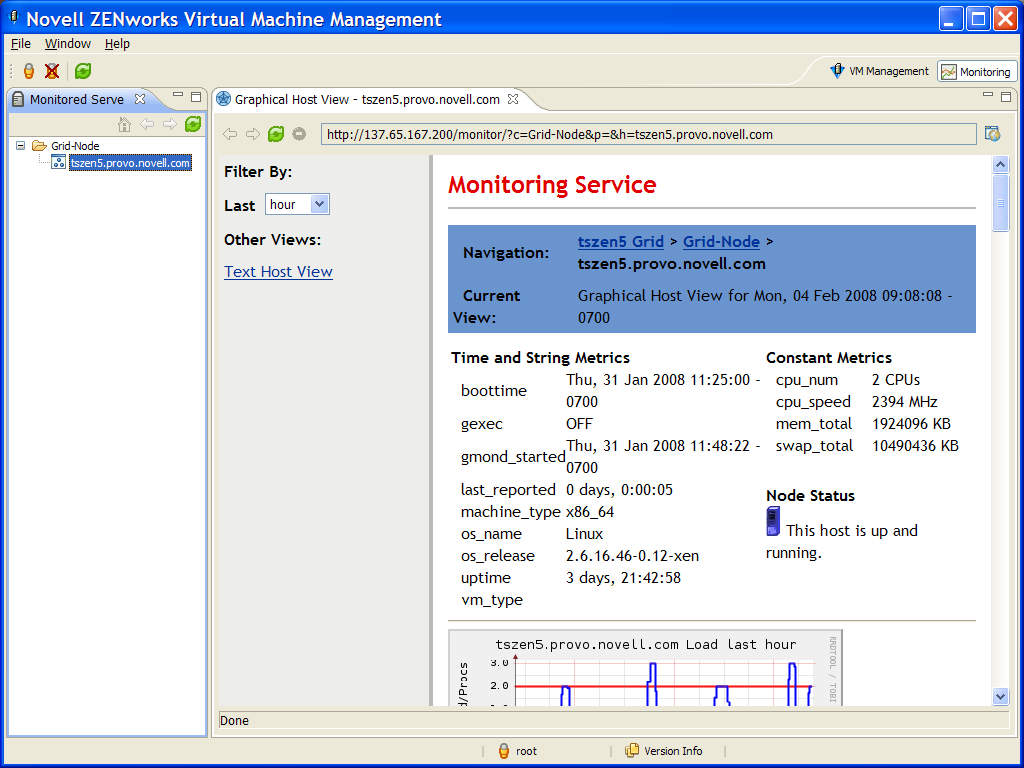
Click the button at the top right corner of the screen to access the ZENworks Orchestrator Monitoring Service. The Monitoring Service to allows you to monitor many elements of the data center in both virtual and physical machines (including the VM host machines), aiding you in the overall management of your data center. You can view this information in a text or graphical mode.
The following figure represents a sample Monitoring Service page in a graphical view:
Figure 2-8 ZENworks Monitoring Service Graphical View
The following figure represents a sample Monitoring Service page in a text view:
Figure 2-9 ZENworks Monitoring Service Text View
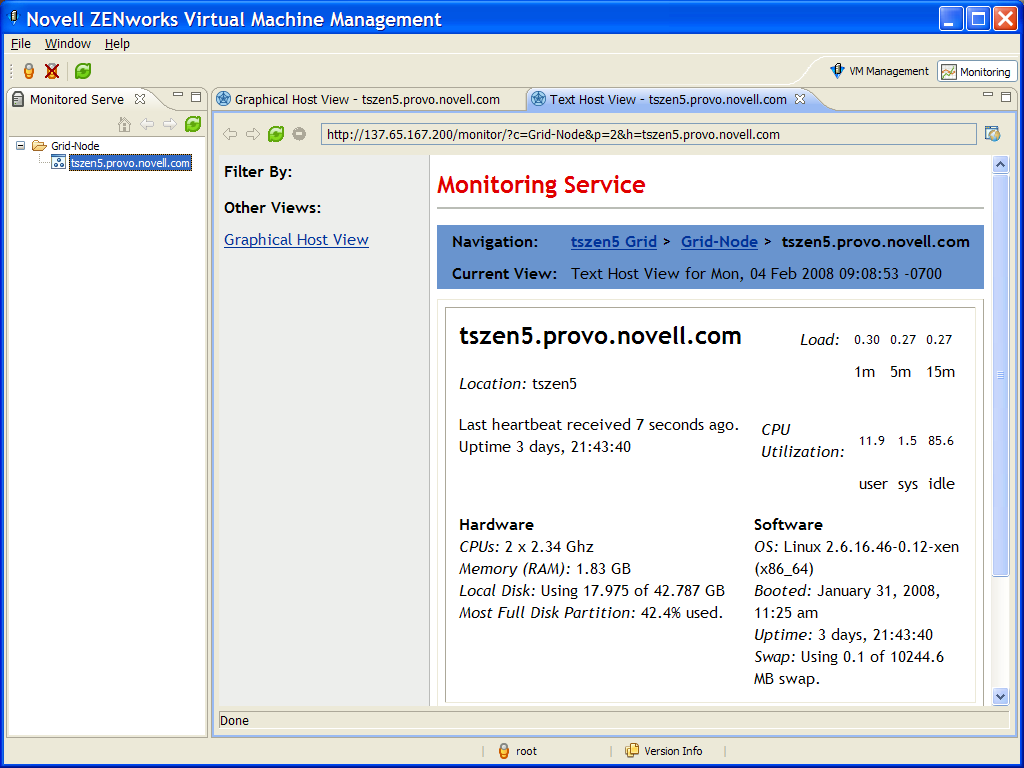
The left pane displays the groups or clusters of physical and VMs you can monitor. In the editing pane, you see a Web page where you define the parameters of how you want to monitor the selected machine. You can set the metric, time constraint, and how you want the data sorted in the display from the drop-down boxes on the left of the edit view. For details about the monitoring service, see Section 5.2, Monitoring Virtual Machines.