1.1 The Constraints Table View
The left side of the Policy Debugger page is referred to as the Constraints Table view.
Figure 1-2 The Constraints Table View
The appearance of this view can change, depending on the constraint type you select in the drop down menu. For a description of these types, see Section 1.1.2, The Constraint Type List.
The Constraints Table View is composed of several parts:
1.1.1 The Match Context Area
The policy debugger provides the general identification of a job instance in the area of the Constraints Table View. The Match Context defines everything associated with running a job on a particular resource it references Facts, which are also referenced in Policies. The Policies define how, when, and where the job runs.
Figure 1-3 The Match Context Area of the Constraints Table View in the Policy Debugger
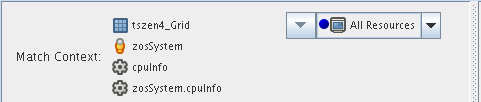
That identifying Facts in the Match Context include:
-
Matrix: The
 icon and a text string identifies the machine that matches the grid name given to the Orchestrator Server where this job is running.
-
User: The
 icon and a text string identifies the User object that matches the user who is running the job.
-
Job: The
 icon and a text string identifies the deployed Job that matches the one that is running on the grid.
-
Job Instance: The
icon and a fully qualified text string identifies the specific Job instance that matches the deployed job running on the grid.
-
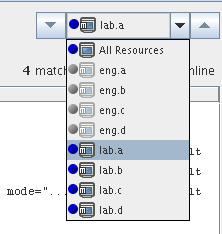
Resource: The Resource drop down list shows all resources. The list appears in the Match Context if the constraint type is selected. The resources in the list that are currently offline display with a dimmed icon. If available, a listed resource has a colored dot by its side. The color of the dot (blue
 or gray
  ) and the resource type it accompanies has significance:
-
A blue dot with the label indicates that at least one resource matches the constraints and is capable of servicing the job.
-
A gray dot with the label indicates that no resources match the constraints.
-
A blue dot with a named, selected resource indicates that its constraints match and it is capable of servicing the job.
-
A gray dot by a named, selected resource indicates that its constraints do not match and that it is not capable of servicing the job.
The following figure shows a list of eight resources. Four of those resources (, , and ) are online, and their constraints match so they are capable of servicing the job.
Figure 1-4 Resource Drop Down List Showing Online and Offline Resources
-
1.1.2 The Constraint Type List
Select one of the constraint types in the drop down list to specify a policy context. Constraint types in the list are disabled (dimmed) if they do not apply to the job that you are debugging.
-
accept: accept
-
start: start
-
continue: continue
-
provision: provision
-
allocation: allocation
-
resource: resource
-
vmhost: vmhost
-
repository: repository
1.1.3 The Verbose Check Box
When you select the Verbose check box, the reason string specified in the policy is displayed in the tree. For more information, see Section 1.1.5, The Constraints Column of the Constraints Table View
1.1.4 The Capable Resources Summary
Directly under the Resource List in the constraint view, a populated string summarizes the resources that are capable of servicing the job. For example, 4 matching Resource of 10 online indicates that four of the ten total online resources are capable of servicing the job.
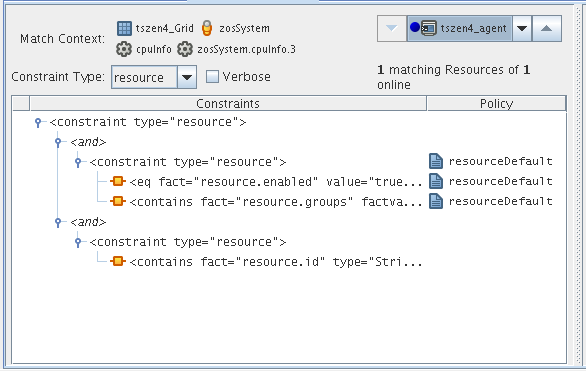
1.1.5 The Constraints Column of the Constraints Table View
The Constraints column of the constraints table view shows the logical hierarchy (that is, a “tree” format) of the constraints that are defined by the Policies associated with the Job. You can identify the status of the listed constraints by the icons that might be displayed in the far left column of the table:
-
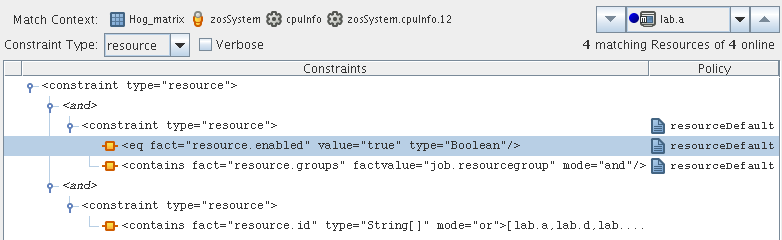
no icon: The constraint passes the match. It is a “true” match. The figure below shows that the resource lab.a is available to run the job because all of its constraints match. No red icons are displayed next to any listed constraint.
-
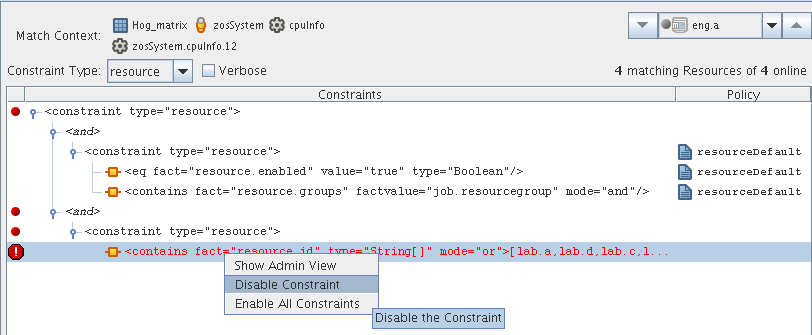
red dot icon: The constraint does not pass the match. The figure below shows that the resource eng.a cannot run the job because its constraints do not match.
-
red octagonal icon: The constraint does not pass the match and is blocking the job. The figure above also shows the blocking constraint (red octagon).
-
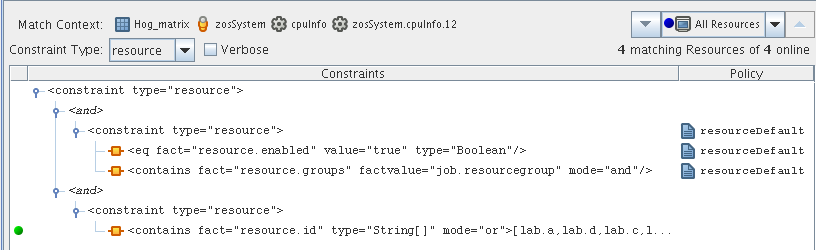
green dot icon: A blocking constraint has been disabled so that it behaves like a match. The figure below shows the green dot icon next to that the constraint that was formerly blocked and can now behave as a match.
If you right-click a constraint in the table, a popup menu with three options is displayed. This menu lets you change the status of the constraint.
-
Show Admin View: Select this option to open the Admin View for the specific resource selected.
-
Disable Constraint: Select this option to disable (attach a green dot icon to) a constraint. Disabling a constraint with this function effectively makes it match, a condition that can prove useful if you want to perform a “what if” test without actually changing a policy.
-
Enable All Constraints: Select this option if you have disabled one or more constraints during testing and you want to restore them to the enabled state.
Cached Constraints in the Constraints Column
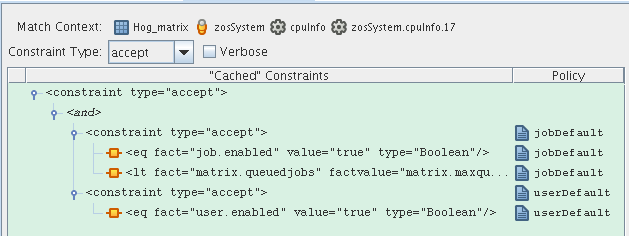
When you change the constraint type in the Constraints Type List, the background of the table changes to green for some types. These are “cached” constraints that are saved with the job after it has completed. Their purpose is to help you debug the policy.
Figure 1-5 Cached Constraints Displayed in the Constraints Table View
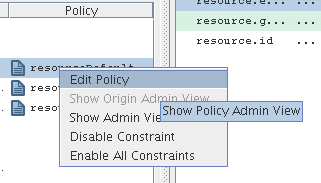
1.1.6 The Policy Column of the Constraints Table
The Policy column of the constraints table displays the policy name that contributed the constraint. Right-click a policy name to open a popup menu offering the option to open the policy editor for the specified policy. The menu also includes constraint enabling or disabling options, just as the popup menu for constraint column does.
Figure 1-6 The Popup Menu Launched from the Policy Column