4.1 Patch Management Pages
The Patch Management pages are where the majority of patch-related activities are performed, to include monitoring all patches across all systems registered to the ZENworks Server. From here you can assess patch compliance, view recently released patches, check patch subscription status, check the last time each device was scanned for patch compliance, search for patches, create custom patches, create and manage patch policies, and more.
4.1.1 Employing the Patch Management Dashboard
The Patch Management Dashboard has four default dashlets that provide a comprehensive snapshot of key indicators, so you can quickly assess the overall health and compliance of patches on devices in your zone. You can also initiate action directly from respective dashlets, when expanded, to remediate, download, or disable selected patches, to discover patches, to reconfigure the zone vulnerability detection schedule, and to view patch and device details.
Custom dashlets: You can create custom dashlets from any of the default dashlets or from other custom dashlets using the Save As feature. This will save the filter settings on a custom dashlet until you change and save different settings. Unlike the filters on the default dashlets, the filters you set on custom dashlets are persisted beyond the current Dashboard page session.
System settings: Dashlets that can be filtered by Platform reflect patches from the platform types selected in the Subscription Service Content Download configuration. For example, if the Linux platform is the only platform type selected for “platforms to download,” then typically only patches from that platform will be shown or can be filtered in the dashlet.
One exception to the above statement is custom dashlets. Any applicable patches already downloaded before a change was made in the “platforms to download” would still be shown in applicable ‘custom’ dashlets if the excluded platform type was previously saved to show in the dashlet.
Dashlet descriptions: A brief description for each default dashlet is provided below. Click a dashlet link for more detailed information about that dashlet.
-
Patch Subscription Status: Displays the number of known patches in the zone, their status, and the last start and end times of subscription activities for licenses, patch discovery, and patch download. Mouse over different sections of the chart to see end times for Patch Download, License Verification, and Patch Discovery, or expand the dashlet for more options.
-
Recently Released Patches: Displays the number of recently released patches by patch impact type. Mouse over different sections of the chart to see the number of patches for each impact type, or expand the dashlet for more options.
-
Device Patch Compliance: Displays compliance status for devices in the zone. Mouse over different sections of the chart to see how many devices are compliant, or expand the dashlet for more options.
NOTE:Patch compliance is measured by Critical and Recommended patch impacts, based on the percentage defined in the Dashboard and Trending configuration. Disabled patches for these impact types are not part of the compliance data.
-
Device Last Patch Scan: Displays the number of devices scanned for patches by time range. Mouse over the chart to see the scan information, or expand the dashlet for more options.
For general information about using the ZENworks Dashboard, see Using the ZENworks Dashboard - An Overview.
Patch Subscription Status
All patching through ZENworks Patch Management begins with retrieving applicable patches into your system via the patch subscription service. The subscription service performs three tasks: it verifies that your license is valid, it discovers new patches that are applicable to devices in your system, and it downloads the patch content as it is needed.
Viewing the Subscription Status is your first indication that your patch process is running smoothly. Use this dashlet to quickly determine the status and end times of these three processes: License Verification, Patch Discovery, and Patch Download. If any of the processes have failed, you have your first indication of where to troubleshoot:
-
License Verification: Check the Patch Management License page to verify that your license has not expired.
-
Patch Discovery: Click the Discover Patches link in the Subscription Status dashlet to scan for new patches in the patch content repository. If new patches are detected, the patch signatures will be downloaded to your devices, so they can be detected in the next DAU scan.
-
Patch Download: Check your network environment to ensure patch content is not restricted due to closed ports or other firewall issues. For more information, see Patch Management Issues.
Recently Released Patches
By default, the Recently Released Patches dashlet displays all applicable patches discovered on devices in your Management Zone that were released in the last 30 days. Viewing the information in the default configuration might initially help you determine how to best configure the dashlet for your organization’s needs by asking questions such as:
-
What platform types do I need to patch?
-
What patch impact types do I want to include?
-
Do I want to see applicable patches from all vendors or just selected vendors in my dashboard?
From the expanded Recently Released Patches dashlet, you can configure the dashlet to only display those patches that you require to accurately assess your patch environment going forward. You can also create custom dashlets by saving the Recently Released Patches dashlet with another name.
Modify the data display: To filter the data that the dashlet displays, expand and modify any of the sections in the dashlet filter panel for Release Period, Platform, Impact, and Vendors, and then apply your changes.
Execute actions from the Patches panel: The Patches panel displays the patches that meet the criteria you define in the dashlet filter panel. You can also filter the list by searching for any portion of a patch name string via the Search Patches feature.
For information about other actions and options you have in the Patches panel, see the following:
-
Remediate patches: If you see a patch that you need that will not be picked up by your patch policy, you can start remediation of the patch directly from the Patches panel. To start remediating patches, select one or more patches in the list, and click Remediate.
Step 1 in the remediation process opens. For information about using the Remediation wizard, see Deploying Patches Manually.
-
Disable patches: To disable one or more patches, select them in the Patches panel and click Disable.
NOTE:There is no confirmation of this action. Once you click Disable, the action is executed.
To enable a disabled patch, go to the Patch Management > Patches page, locate and select the patch, and click Enable from the Action menu.
-
Download patches: To download one or more patches, select them in the Patches panel, and click Download. A green status icon indicates that the patch or patches are downloaded.
-
View patch information: To view vendor details about a patch, click the patch name in the Patches panel. The Patch information page provides useful details about the patch and a link to the vendor site.
-
View patched or not patched devices: To see which devices are applicable to which patches, click the applicable number link in the Patched or Not Patched column. This will list the devices that already have or need that patch, respectively. The list of devices will also include a link to the Summary page for each device in the list.
-
Sort the Patches list: To sort the list alphanumerically by column criteria, click a column header. Clicking the column a second time will invert the order of the sort.
Device Patch Compliance
When expanded, the Device Patch Compliance dashlet provides a quick snapshot of how many devices are compliant and how many are not, both by the number of devices in the chart and by percentages in the Devices panel. You can modify the threshold that you want for patch compliance in the Dashboard and Trending configuration. For more information on this setting, see Configuring Patch Dashboard and Trending.
Modify the data display: To filter the data that the dashlet displays, expand and modify any of the sections in the dashlet filter panel for Status, Impact, Device Type, and Platform, and then apply your changes.
Viewing options in the Devices panel: The Devices panel displays compliance status for each device in your zone by percentage, based on the criteria you define in the dashlet filter panel and compliance criteria in the Dashboard and Trending Configuration. You can also filter the list by searching for any portion of a device name via the Search Devices feature.
To see specifically which patches are compliant for each device, click a percentage link in either the Critical Patches or Recommended Patches column for a device in the list, and the Patches page will open for that device.
Device Last Patch Scan
Checking the data in the Device Patch Last Scan dashlet can help you determine the health of your current patch environment. When expanded, you can compare the latest scan with information from other patch dashlets and even go directly to the Vulnerability Detection Schedule to modify scan times, if there is a need.
Modify the data display: To filter the data that the dashlet displays, expand and modify any of the sections in the dashlet filter panel for Time Ranges, Platform, and Device Type, and then apply your changes.
Viewing options in the Devices panel: The Devices panel displays the last scan date and the next scheduled scan time for each device.You can also filter the list by searching for any portion of a device name via the Search Devices feature.
For information about other actions and options you have in the Devices panel, see the following:
-
View detailed device information: To see specific information about a device in the Devices panel, click the device name.This will open the Summary page for that device.
-
Modify the scan schedule: To go directly to the Vulnerability and Detection Schedule in the Patch Management configuration, click the link in the Scan Schedule Defined At column for any of the devices in the Devices panel. From here, you can modify the zone schedule that checks for device vulnerability.
-
Sort the Devices list: To sort the list alphanumerically by column criteria, click a column header. Clicking the column a second time will invert the order of the sort.
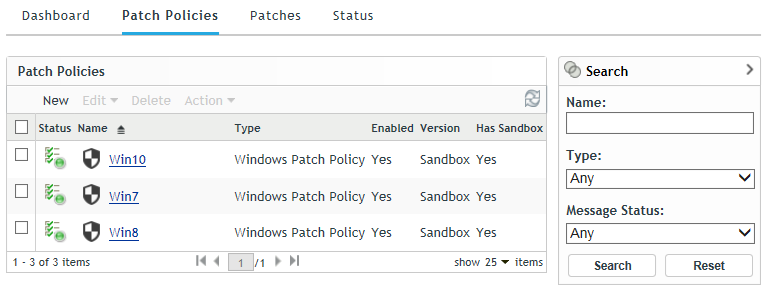
4.1.2 Viewing Patch Policies
You view, create, modify, and delete patch policies from the Patch Policies page. For detailed information about creating and managing patch policies, see Creating and Publishing Patch Policies.
To view patch policies, navigate to Patch Management > Patch Policies.
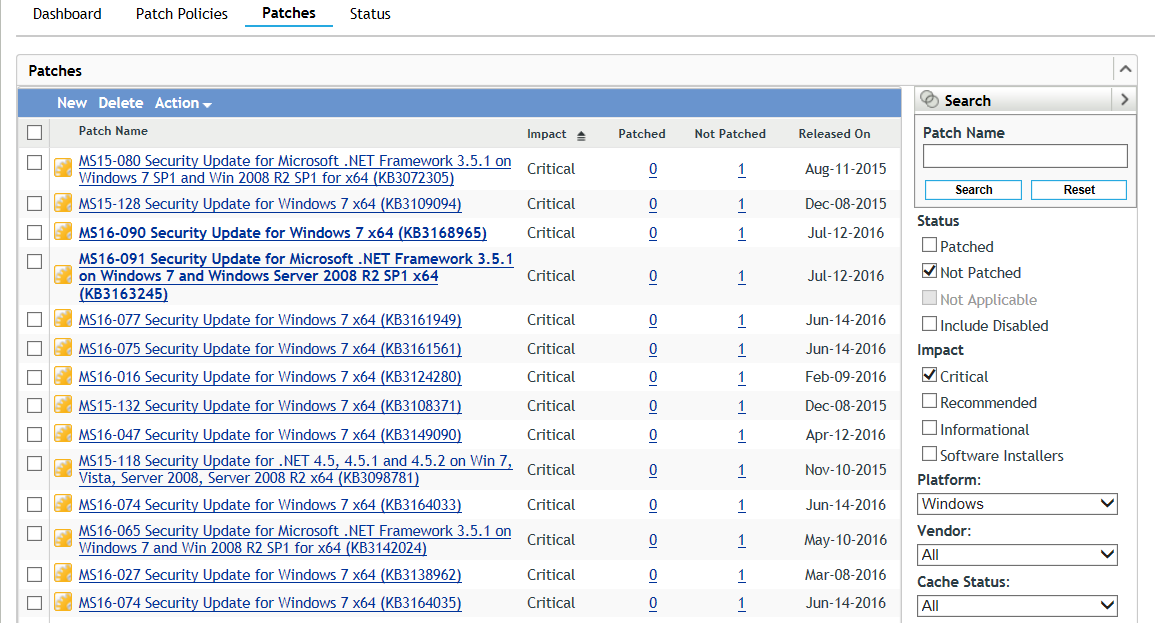
4.1.3 Viewing Zone Patches
To view the patches that are discovered in the zone from the DAU tasks, click Patch Management in the navigation menu, and select the Patches page.
The Patches page displays a complete list of all known patches reported by various software vendors. After they are reported and analyzed, the patches are registered for distribution to your ZENworks Server through the ZENworks Patch Subscription Network. The ZENworks Agent should be installed on each device to check for known patches. A patch bundle called Vulnerability Detection is then assigned to run on each device on a daily basis to scan for known patches. This task returns the results that are displayed on the Patches page. The results are presented in a table of patch status. The total number of patches is displayed below the table in the bottom left corner.
NOTE:The Patches page downloads and displays patches only for the operating systems that are running on your managed devices. This process prevents wastage of bandwidth and disk space, which would be required to store thousands of unneeded patches in the ZENworks Primary Server database. If you connect a device running a previously undetected operating system, you must initiate replication again so that the Patch Management Server downloads patches for that operating system.
4.1.4 Viewing Patch Status
The Status page displays the download status for patches and bundles in table form, and also displays the details of patch caching and queuing status.
To view the Status page, navigate to Patch Management > Status.
The page consists of two data tables, Status and Cache Status. Definitions for each table item are provided below:
Table 4-1 Status Item Definitions
|
Item Name |
Item Status |
|---|---|
|
Signature Download |
Indicates whether downloading of the signature has finished or is in progress. |
|
Signature Download Time |
Indicates the last time the local server contacted and downloaded the signature from the Patch Subscription server. |
|
Bundle Download |
Indicates whether the patch bundle download is finished or is in progress. |
|
Last Patch Download |
Indicates the last time the local server contacted and downloaded a patch from the Patch Subscription server. |
|
Number of Failed Download(s) |
Indicates the number of patches that failed to download from the Patch Subscription server. |
|
Number of Patches Queued for Caching |
Indicates the number of patches that are queued for download from the Patch Subscription server. |
|
Number of Active Patches |
Indicates the number of patches that are available for download from the Patch Subscription server. |
|
Number of New Patches (less than 30 days) |
Indicates the number of patches that have been uploaded to the Patch Subscription server in the last 30 days and are available for download. |
|
Latest Patch Released On |
Indicates the time when the latest patches were released. |
Table 4-2 Cache Status Item Definitions
|
Item |
Definition |
|---|---|
|
Action > Cancel Pending Downloads |
Cancels the download of any patches in the process of being cached. |
|
Name |
The name of a patch. |
|
Status |
Whether the patch has been successfully downloaded. |
|
Error Detail (if any) |
Details of any error that occurred during the download process. |