4.2 Using the ZENworks Diagnostics Tools

A new diagnostics dashboard and diagnostics tool is available in ZENworks Control Center to monitor the health of your zone and troubleshoot. Using ZENworks Diagnostics, it is possible to use the ZENworks Control Center interface to inspect and debug the state of the ZENworks servers in the zone. ZENworks Diagnostics provides the ZENworks Administrator an intuitive portal to check the state of the LDAP sources (eDirectory or Active Directory). It also provides a probe feature wherein the different processes running on the ZENworks Server can further be analyzed or debug information can be collected very easily and provided to Micro Focus Customer Support for analysis. Therefore, Diagnostics will help to narrow down any specific issues within the ZENworks zone. For information, see:

4.2.1 Understanding the Diagnostics Landing Page

When you first access the Diagnostics page in the ZENworks Control Center, the following landing page is displayed:

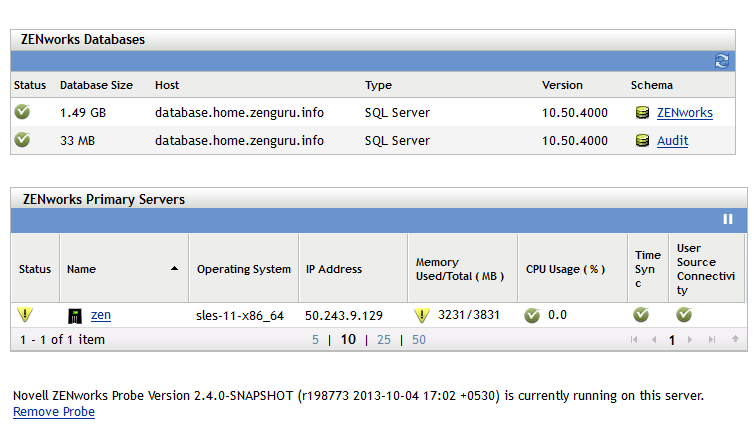
ZENworks Databases Snapshot

The ZENworks Databases snapshot displays the Status, Database Size, Name of the Host Database, Type, Version, and Schema of the databases present in the zone.

In a ZENworks zone, you will always see two rows listed: one for the ZENworks database and one for the Audit database. If you click the Schema hyperlink, it opens a pop-up dialog that lists the tables in the database, along with the row counts for each table.

ZENworks Primary Servers Snapshot

The ZENworks Primary Servers snapshot displays the Status, Name, Operating System, IP Address, Memory Used/Total(MB), CPU Usage(%), Time Sync, and User Source Connectivity of the Primary Servers. The following information might be of particular interest:

ZENworks Services Dashboard

The ZENworks Processes page is displayed when you click any of the Primary Server names. This page provides information about the Java processes, as shown below:

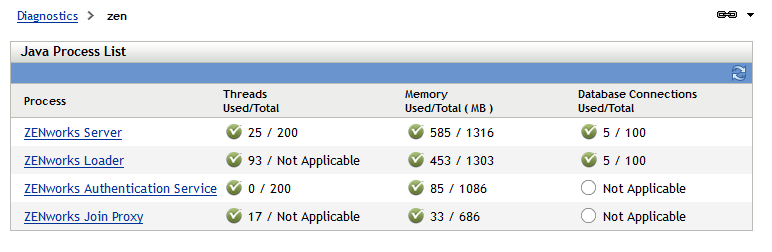
The Java Process List panel displays the following information:

  • Process: The list of processes. Click any of the following processes to open the ZENworks Probe page:

    • ZENworks Server

    • ZENworks Loader

    • ZENworks Authentication Service

    • ZENworks Join Proxy

    • ZENworks Xplat Agent

  • Threads Used / Total: The number of threads used by the process compared to the maximum number of threads allowed by the thread pool for ZENworks Server and ZENworks Authentication Service. Because the ZENworks Loader and ZENworks Join Proxy do not use thread pools, this field shows the number of threads running. If multiple thread pools are configured, this field shows the thread pool that is using the maximum number of threads.

  • Memory Used / Total (MB): The amount of Java Heap memory used by the process compared to the maximum memory available.

  • Database Connections Used / Total: The database connections used by the process compared to the maximum connections available.

4.2.2 ZENworks Probe

ZENworks Probe is available on all Primary Servers. The version of the ZENworks Probe that is running on the server is displayed on the Diagnostics page.

ZENworks Probe can be deployed or removed from the Diagnostics page. Click Remove Probe to undeploy the probe. If Probe is not deployed, click Deploy Probe. Select the appropriate .war file, then click OK.

You can deploy the latest version of Probe by removing the existing ZENworks Probe deployment from the server. To obtain the latest version of the Probe .war file, go to the Novell download site. If you want to redeploy Probe, remove Probe and extract the package.

Extract the package novell-zenworks-probe.msi (Windows) / novell-zenworks-probe.rpm (Linux) or copy the .war file from other Primary Servers.

You will not need to restart the server after deploying Probe.

NOTE:Generally you will use the ZENworks Probe utility under the direction of a Micro Focus Customer Support engineer.

The ZENworks Probe page has the following tabs:

Applications

The Application tab provides the following information about each web application deployed on the Tomcat server: the name of the web application and the total number of requests processed, whether it is running, the total number of sessions, session timeout, and whether it is distributable.

When you click on any application, the following information is presented:

Application Summary

The Application Summary page gives you the information that is specific to the selected application, including: Doc.Base, Servlet Version, Number of servlets present for that application, Session Timeout, and whether it is serial or not.

The graphical representation of NUMBER OF REQUESTS and AVERAGE RESPONSE TIME helps users determine the load for that application at any given time.

The Application Information panel displays the Application name, Doc.base, Description, Servlet Version, Servlet count, Session Timeout, and Clustered Application information.

The Statistics Charts panel displays the following statistics for the application:

  • Number of Requests: A chart with coordinates corresponding to the REQUEST COUNT (Total number of requests for that application) and ERROR COUNT (Number of errors).

  • Average Response Time (MS): A chart with coordinates corresponding to PROCESSING TIME (processing time for the request), MIN TIME (minimum time), MAX TIME (maximum time), and AVG RESPONSE TIME (average response time). This can be useful in identifying the normal time and then looking for periods of time outside the normal value.

Application Deployment Descriptor

The Application Deployment Descriptor page displays the web.xml file of the application. This contains important information such as url-mapping, which helps you understand which servlet will be called for a specific type of URL.

Application Servlet

The Application Servlet page displays the following information:

  • Name: Name of the servlet.

  • Avail: Availability of the servlet.

  • Startup: Sequence in which the servlet is loaded at the servlet container startup.

  • Req: Number of requests processed by each servlet.

  • Proc Time: The time taken by the servlet to process all the request received.

  • Err: Error count.

  • Min Time: Minimum time taken to process the request.

  • Max Time: Maximum time taken to process the request.

  • Multi Thrd: Whether the servlet is multithreaded.

  • Servlet Mappings: Opens the Servlet Mapping page.

    The Servlet Mapping page displays the following information: URL, SERVLET NAME, SERVLET CLASS, and AVAIL mapping between the servlets and the URLs.

  • Show All: Opens the Servlet page, which lists the information for all servlets on the Tomcat server.

Threads

The Threads tab displays the following information and allows you to dump the thread pool information for the current Java Virtual Machine.

  • Exexx Point: The current execution point for the thread.

  • In.Native: Whether the thread is executing native code.

  • Susp: Whether the thread is suspended.

  • WC: The total number of times the thread was in wait notification state. That is, the number of times a thread has been in java.lang.Thread.State.WAITING state or java.lang.Thread.State.TIMED_WAITING state.

  • BC: The total number of times the thread was blocked. That is, the number of times a thread has been in the java.lang.Thread.State.BLOCKED state.

  • Threads Pool: Click this link to open the Threads Pools page.

  • Dump All Threads: Click this link to access the thread dump of the system in its present state. This can be saved on the local machine and opened in any thread dump analyzer. This is a commonly requested operation by Micro Focus Customer Support and Micro Focus Engineering.

System

The System page of the ZENworks Probe utility provides links to the following system information:

Overview

The Overview page provides information about memory utilization, operating system, the Tomcat container, and the JVM being used.

From this page you can see the following information:

  • Free: The amount of Java Heap space available for this JVM.

  • Total: The total memory space.

  • Max: The maximum memory space available.

  • Dump Heap: Click this link to generate the memory dump of the JVM. This is stored in the machine where the target JVM is running.

Memory Utilization

The Memory Utilization page displays the memory utilization for Java objects in different generations and based on the usage, can even advise for garbage collection. This page has the following panels:

Current Memory Usage

  • Name: Name of the pool.

  • Usage Score: The usage score bar chart.

  • Plot: Hides or unhides the memory usage graph.

  • Used: The amount of memory currently used, including the memory occupied by all objects, both reachable and unreachable.

  • Committed: The amount of memory guaranteed to be available for use by the JVM. The amount of committed memory might change over time. For example, the Java virtual machine might release memory to the system, so the amount of committed memory could be less than the amount of memory initially allocated at startup. The amount of committed memory will always be greater than or equal to the amount of used memory.

  • Maximum: The maximum amount of memory that can be used for memory management. Its value could change or be undefined. A memory allocation could fail if the Java VM attempts to increase the used memory to an amount greater than committed memory, even if the amount used is less than or equal to maximum value (for example, when the system is low on virtual memory).

  • Initial: Initial memory allocated.

  • Total: Total memory allocated.

From here you can also initiate the garbage collection process and initiate a Java Heap dump if requested to do so by Micro Focus Customer Support or Micro Focus Engineering.

MEMORY USAGE HISTORY

  • Permanent Generation (non-heap): The pool containing all of the reflective data on the virtual machine itself, such as class and method objects. With Java VMs that use class data sharing, this generation is divided into read-only and read-write areas.

  • Tenured Generation (heap): The pool containing objects that have existed for some time in the survivor space.

  • Survivor Space (heap): The pool containing objects that have survived the garbage collection of the Eden space.

  • Code Cache (non-heap): The HotSpot JVM also includes a code cache, containing memory that is used for the compilation and storage of native code.

  • Eden Space (heap): The pool from which memory is initially allocated for most objects.

System Properties

This page shows you all the system properties that are known in the Java Virtual Machine environment.

OS Information

The OS Information panel displays information about the OS Name and Version, overall memory usage, and information related to swap file usage. This page is a good indicator that you might be low on memory if you are seeing a large amount of swapping.

From this page you can also see graphs over time for JVM CPU Utilization, OS and Java Memory Usage, and Swap Usage.

Connectors

The Connectors page provides the list of connectors and its information for Tomcat servers. The charts in this tab help users find out the number of incoming requests for each connector, how much time it took to process at each interval, and the amount of data that was transferred at each interval. The user can find the remote IP that is requesting for a particular URL and the time it took to process that request.

The following chart is displayed for each connector type:

  • Number of Requests in Each Interval: Number of requests in each interval.

  • Processing Time (MS) in Each Interval: Processing time spent for the requests in each interval.

  • Traffic Volume (Bytes) in Each Interval: Traffic volume in each interval.

This page also shows the remote IP of the request, the stage of the request, processing time for the request, and the originating URL of the request.