7.5 Managing Messages
The Message Logger component lets you manage the messages logged by the other components of Novell ZENworks.
7.5.1 Understanding Message Formats
Messages are logged in different formats depending on the output targets such as local log, e-mail notification, SNMP traps, and UDP notification.
All error messages log the component name on which the error is generated. To troubleshoot the error, refer to the component’s Reference Guide.
Example 1: Error related to Policy Management.
[DEBUG] [7/22/2007 3:42:45 PM] [] [PolicyManager] [] [Name = RM_dev, Guid = 271414163524d000190dbc6fa94272aa, Type = remote management policy, Version = 2] [] [].
To troubleshoot this error, see the ZENworks 11 SP4 Configuration Policies Reference.
Example 2: Error related to Remote Management.
[ERROR] [15-07-2007 12:44:16] [] [Remote Management] [RemoteManagement.VNCEVENT_CANNOT_OPEN_EVENT] [Unable to open the <ZRMUserLoginEvent> event] [] [].
To troubleshoot this error, see the ZENworks 11 SP4 Remote Management Reference.
Local Log File Format
Messages are logged on the managed device and ZENworks Server in the following format:
[severity] [loggingTime] [userGUID] [componentName] [MessageID] [MessageString] [additionalInfo] [RelatedGUID].
For example, [DEBUG] [1/22/2007 12:09:15 PM] [] [ZMD] [] [refreshing QuickTaskRefresh(GeneralRefresh)] [] [].
E-Mail Format
An e-mail message consists of the message header and the message body:
Message Header
The subject field in the e-mail can be customized as required by using keyword substitution macros:
|
Macro |
Value |
|---|---|
|
%s |
Severity of the message. |
|
%c |
Name of the component. |
|
%d |
ID of the device at which the message is generated. |
|
%t |
Time of the message generation. |
|
%a |
Alias name of the device where the message is generated. |
For example, if you want the subject line to display as “ERROR occurred on device Testifies at 4/1/07 5:31:01 PM”, then specify “%s occurred on device %a at %t” in the Subject field.
Message Body
The message body consists of the following fields:
-
Device Alias: Name of the device where the message is generated.
-
Device IP Address: IP Address of the device where the message is generated.
-
Error: [Date] Component name Message ID localized message string.
-
Additional Information: (Optional) Any additional information.
SNMP Message Format
The SNMP messages consists of the following two parts:
SNMP Message Header
The following fields are contained in the header:
Version Number: Specifies the version of SNMP used. ZENworks 11 uses SNMPv1.
Community String: Defines an access environment for a group of network-management systems (NMS).
Protocol Data Unit (PDU)
The following fields are contained in the PDU:
Enterprise: Identifies the type of managed object generating the trap. ZENworks 11 uses 1.3.6.1.4.1.23.2.80.100.
Agent Address: Provides the IP address of the machine where the trap was generated.
GenerIc Trap Type: Contains the integer value 6. Type 6 is an enterprise-specific trap type, which has no standard interpretation in SNMP. The interpretation of the trap depends upon the value in the specific trap type field, which is defined by the Message Logger MIB.
Specific Trap Code: For enterprise-specific traps generated by ZENworks 11, the values in the specific trap type fields are as follows:
-
For a severity level of MessageLogger.ERROR, the specific trap is 1.
-
For a severity level of MessageLogger.WARN, the specific trap is 2.
-
For a severity level of MessageLogger.INFO, the specific trap is 3.
Time Stamp: The time stamp indicating when the trap occurred.
Variable Bindings: Provides additional information pertaining to the trap. This field consists of the following name/value pairs:
-
For trap ID 1.3.6.1.4.1.23.2.80.100.0.1, the value is the device GUID.
-
For trap ID 1.3.6.1.4.1.23.2.80.100.0.2, the value is the device name.
-
For trap ID 1.3.6.1.4.1.23.2.80.100.0.3, the value is the component name.
-
For trap ID 1.3.6.1.4.1.23.2.80.100.0.4, the value is the time when the message was logged.
-
For trap ID 1.3.6.1.4.1.23.2.80.100.0.5, the value is the message ID.
-
For trap ID 1.3.6.1.4.1.23.2.80.100.0.6, the value is the probable cause.
UDP Payload Format
The payload is a byte array with null-terminated delimiters such as \0 or 0 x 00 (hexadecimal) for each element. Each element’s data is presented as UTF-8 encoded strings and is explained below:
-
The first element is the ZENworks version information. For example, 10.
-
The second element is the value of severity of the message. The severity values are 4 for Informational, 6 for Warning, and 8 for Debug messages.
-
The third element is the message date. The date is not locally specific and is represented as a UTF-8 string. For example, 09-Mar-2008 14:15:44.
-
The fourth element is the user ID.
-
The fifth element is the component name.
-
The sixth element is the non-localized message ID.
-
The seventh element is the localized message string.
-
The eighth element is the additional information.
-
The ninth element is the probable cause URL.
-
The tenth element is the related GUID objects separated by commas.
NOTE:If the element does not have any data, it is represented as \0\0.
7.5.2 Viewing the Message Status
In ZENworks Control Center, you can view the status of the logged messages in the following panels on the home page.
Message Summary
The Message Summary panel displays the number of critical, warning, and normal messages generated on the main objects in the Management Zone.
Figure 7-1 Message Summary

In the Message Summary panel, you can do the following:
-
Click an object type to display its root folder. For example, click Servers to display the Servers root folder.
-
For any object type, click the number in one of its status columns (


 ) to display a listing of all the objects that currently have that status. For example, to see the list of servers that have a normal status, click the number in the column of the Servers.
-
For any object type, click the number in the Total column to display all of the objects of that type having critical, warning, or normal messages. For example, click the Total count for Servers to display a list of all servers having messages logged.
Device Hot List
The Device Hot List displays a list of the devices that have a noncompliant  status or have generated critical
  or warning
  messages. The device remains in the hot list until you resolve the compliancy problem and acknowledge the messages. You can use this list as a summary of problems that need attention on the device.
To view the Device Hot List:
-
In ZENworks Control Center, click the Home tab.

-
 This column indicates the number of bundles or policies that could not be applied to the device because an error occurred. You must review the error and warning messages to discover the compliance problem. The noncompliant status applies only to ZENworks Configuration Management. ZENworks Asset Management does not use this status.
-
 This column indicates the number or unacknowledged error messages generated for the device. An error is any action that fails so the ZENworks Adaptive Agent cannot complete the action on the device.
-
 This column indicates the number of unacknowledged warning messages generated for the device. A warning is any action that encounters a problem; the problem might or might not result in the ZENworks Adaptive Agent completing the action on the device.
-
-
Click the device to display its message log.
7.5.3 Viewing the Messages
In the ZENworks Control Center, you can view the logged messages as follows:
Message Log
The Message Log displays all unacknowledged messages generated for the object.
To view the message logs:
-
In ZENworks Control Center, click the Device Hot List on the home page, then click the device to view its message log.
You can also use the Devices menu to view the logs:
-
In ZENworks Control Center, click Devices.
-
Click Servers or Workstations to display the list of managed devices.
-
Click the name of a device, then click the Summary tab to display:
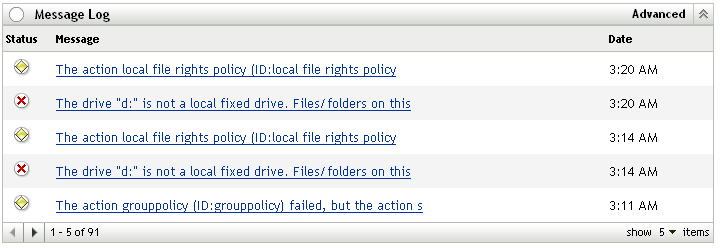
Status: Displays an icon indicating the type of message:
 Critical Message
 Warning
 Normal
Message: Displays a brief description of the event that occurred.
Date: Displays the date and time the event occurred.
-
To view the log messages in the advanced view, click Advanced on the right corner of the Memory Log panel.
You can acknowledge or delete messages from the message log. For more information on acknowledging messages, see Section 7.5.4, Acknowledging Messages, and for information on deleting messages, see Section 7.5.5, Deleting Messages.
System Message Log
The System Message Log panel displays the unacknowledged messages generated by the ZENworks Servers and managed devices in the Management Zone.
-
In ZENworks Control Center, click Configuration.
-
Click System Information to display the System Message Log.

Status: Displays an icon indicating the type of message:
 Critical Message
 Warning
 Normal
Message: Displays a brief description of the event that occurred.
Date: Displays the date and time the event occurred.
-
To view the log messages in the advanced view, click Advanced on the right corner of the System Memory Log panel.
You can acknowledge or delete messages from the system message log. For more information on acknowledging messages, see Section 7.5.4, Acknowledging Messages, for information on deleting messages, see Section 7.5.5, Deleting Messages.
7.5.4 Acknowledging Messages
An acknowledged message is one that you have reviewed and marked as acknowledged ( ).
).
Acknowledging a Message
-
In the Message Log panel or the System Message Log panel, click the message you want to acknowledge.
-
In the Message Detail Information dialog box, select the Acknowledge option, then click OK:
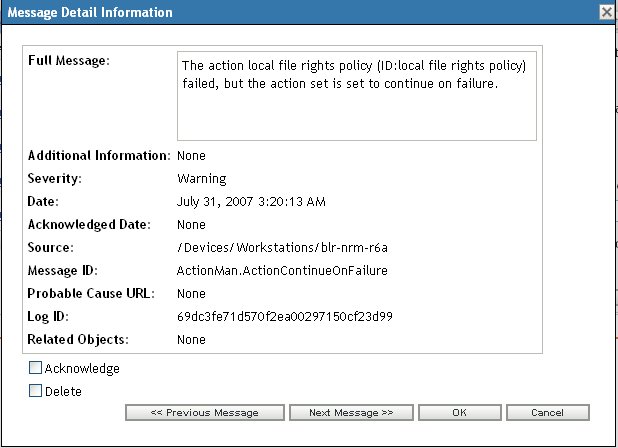
The acknowledged messages are removed from the Message Log panel or the System Message Log panel, depending on which panel you selected in Step 1.
The acknowledged messages continue to be listed in the Advanced view of these logs, marked with a check mark (
 ).
).
Acknowledging Multiple Messages
-
In the Message Log panel or the System Message Log panel, click Advanced on the right corner of the panel.
-
Select the messages to acknowledge, then click Acknowledge:
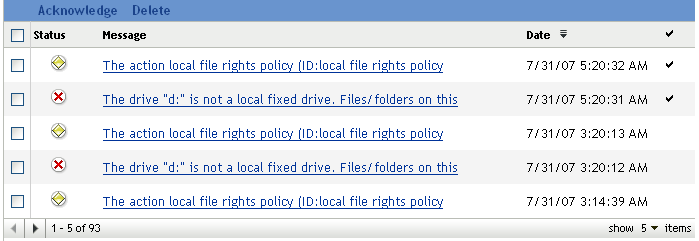
The acknowledged messages are marked with a check mark (
 ).
).
Acknowledging Messages Logged During a Specified Time
-
In ZENworks Control Center, click Configuration.
-
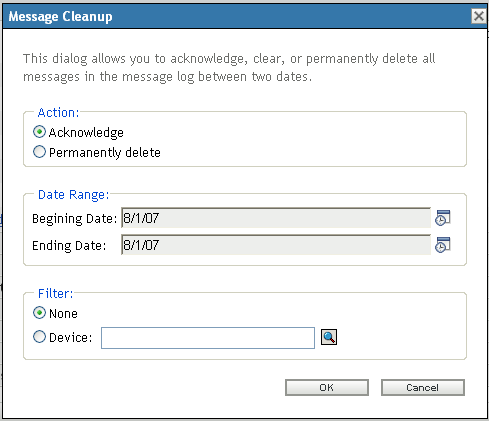
In the Configuration Tasks, click Message Cleanup to display:
-
In the Message Cleanup dialog box, select Acknowledge.
-
In the Date Range option, select the Beginning Date and the Ending Date.
-
Select the Filter option:
None: Cleans up the messages in selected date range from all the devices.
Device: Cleans up the messages in selected date range from the selected device.
-
Click OK.
A message cleanup action is initiated and a system message is logged after the cleanup action is completed. For more information on viewing system logs, see System Message Log.
7.5.5 Deleting Messages
Deleting a message completely removes the message from your ZENworks system.
Deleting a Message
-
In the Message Log panel or the System Message Log panel, click the message you want to delete.
-
In the Message Detail Information dialog box, select the Delete option, then click OK:

Deleting Multiple Messages
-
In the Message Log panel or the System Message Log panel, click Advanced on the right corner of the panel.

-
Select the messages to delete, then click Delete.
Deleting Messages Logged During a Specified Time
-
In ZENworks Control Center, click Configuration.
-
In the Configuration Tasks, click Message Cleanup.

-
In the Message Cleanup dialog box, select Permanently Delete.
-
In the Date Range option, select the Beginning Date and the Ending Date.
-
Select the Filter option:
None: Cleans up the messages in selected date range from all the devices.
Device: Cleans up the messages in selected date range from the selected device.
-
Click OK.
-
In the Confirm Delete Dialog box, click OK to delete the message.
A system message is logged after the cleanup action is completed. For more information on viewing the system log see, System Message Log.