Understanding Traffic Analysis
This section contains basic information to help you understand traffic analysis and describes the Novell ZENworks Server Management traffic analysis components.
- Traffic Analysis Components
- Communication Between Traffic Analysis Components
- Traffic Analysis Features
- Traffic Analysis Fundamentals
Traffic Analysis Components
The Novell ZENworks Server Management traffic analysis components include:
Management Server
The management server comes with the robust and highly scalable Sybase* Adaptive Server Anywhere that stores static information, such as the names and addresses of the nodes and devices in your network. The management server components include the NetExplorerTM, management database, Consolidator, and Atlas Manager. NetExplorer discovers the objects in your network and stores them in the management server. The Consolidator takes the information about network objects discovered by NetExplorer and builds the management database. For details about the functionality of NetExplorer, see Understanding Network Discovery.
The management database is comprised of the Common Information Model (CIM) schema that is used to establish the topology of the network. The CIM schema extension capabilities provide the ability to organize the information in the database and give this information the shape of a network map. The Atlas Manager obtains information from the management database and displays the network map on Novell ConsoleOne.
Management Console
Novell ConsoleOne®, the Novell® directory-enabled, Java*-based network management and administration tool, is the management console component. Novell ZENworks Server Management snaps in to Novell ConsoleOne and expands Novell ConsoleOne's capabilities by adding menu options, property pages for existing NovellTM objects, and ways to browse and organize network resources. Novell ConsoleOne provides an intuitive, graphical user interface for Novell ZENworks Server Management traffic analysis. For details about the functionality of Novell ConsoleOne, see Managing the Atlas.
Monitoring Agent Server
Before you start analyzing segments or devices on your network, you need to ensure that they are monitored. To enable monitoring, make sure you have installed the network monitoring agent software either on the management server or on an independent server in your network. For more information, see "Management and Monitoring Services Installation" in the Novell ZENworks 6.5 Server Management Installation Guide. Network monitoring agents gather information or provide services that help you monitor your network.
An agent program using parameters you have provided searches all or part of your network, gathers information you query, and presents it to you when you require it. You can use the information gathered by the agent to analyze the traffic on your network. The agent also warns you of problems, such as duplicate IP addresses, by sending an alert to Novell ConsoleOne to help you solve problems before network performance is impacted. For details about managing alarms, see Managing the Alarm Management System.
Network monitoring agents observe traffic and capture frames to build a database of network objects and information to help you detect network aberrations. With the network monitoring agent software installed on a server on each of your segments, you can use the traffic analysis tools to help you monitor the traffic on your network, identify the source of network problems, and maintain optimum performance. For details, see About Network Monitoring Agents. The traffic analysis agents for Novell NetWare® and Windows* are part of Novell ZENworks Server Management that you can use to monitor Ethernet, FDDI, or token ring networks.
Communication Between Traffic Analysis Components
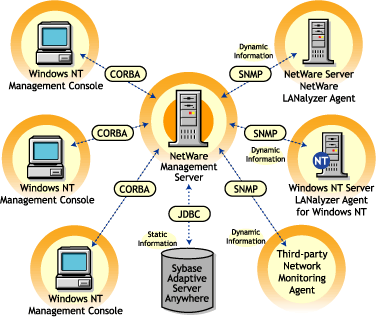
Novell ConsoleOne communicates with the management server using common object request broker architecture (CORBA) to procure dynamic and static information about the nodes and devices in your network. When Novell ConsoleOne requests static information from the management server, the management server communicates with the management database using Java Database Connectivity (JDBC), gathers the required static information from the database, and provides it to Novell ConsoleOne. When Novell ConsoleOne requests dynamic information from the management server, the management server communicates with the network monitoring agent using SNMP, gathers the required dynamic information, and provides it to Novell ConsoleOne.
The following diagram illustrates this communication:
Traffic Analysis Features
The Novell ZENworks Server Management traffic analysis components provide the following features:
- Analyze Traffic Generated by Segments
- Analyze Traffic Generated by Nodes Connected to Segments
- Capture Packets, Decode Captured Packets, and Display Captured Information
- Analyze Traffic Generated by Protocols
- Analyze Traffic Generated by Switches
Analyze Traffic Generated by Segments
You can use the traffic analysis tools to collect current and historical segment statistics that can be displayed in real time, stored for later display, or transferred to a database, spreadsheet, or management reporting system. For details, see Analyzing Traffic on Segments.
Analyze Traffic Generated by Nodes Connected to Segments
The traffic analysis tools allow you to obtain statistical information about nodes on monitored Ethernet, FDDI, or token ring segments, and determine the top nodes on a segment. You can monitor the status of nodes in your network so that you are alerted when a node becomes inactive. You can also view alarms that are generated when preset threshold parameters are exceeded. Alarms that require immediate attention can be forwarded via e-mail to remote users. For details, see Analyzing Traffic on Nodes Connected to a Segment.
Capture Packets, Decode Captured Packets, and Display Captured Information
You can use the traffic analysis tools to capture packets between nodes on a monitored segment, and you can quickly define a capture filter based on which you want the packets to be captured. After packets are captured, protocols are decoded and displayed in color-coded summary, decode, and hex panes. The information obtained from the captured packets can be used to examine the traffic on the segment and to analyze it. By providing analysis capabilities and advanced protocol decodes, the traffic analysis tools allow you to identify network aberrations and resolve network performance problems. For details, see Capturing Packets, Protocol Decodes Suite Supported by Novell ZENworks Server Management, and Displaying Captured Packets.
Analyze Traffic Generated by Protocols
You can use the traffic analysis tools to determine the distribution of protocols in the network, transport, and application layer of your network, and obtain statistical information of protocols discovered by the network monitoring agent. For details, see Analyzing Traffic Generated by Protocols in Your Network.
Analyze Traffic Generated by Switches
You can analyze switch traffic by using the traffic analysis tools to determine port statistics of monitored switches. For details, see Analyzing Traffic on Switches.
Traffic Analysis Fundamentals
Novell ZENworks Server Management provides tools to let you obtain statistical information about segments, nodes, and devices on your network. You can use this information to analyze and manage the performance of traffic on your network to help you keep the network operating smoothly. Novell ZENworks Server Management also provides tools to capture and decode packets between nodes. You can use the decoded information obtained from captured packets to analyze the traffic between nodes.
To be able to analyze the segments and nodes connected to a segment, you need to ensure that the segment is monitored by a network monitoring agent. You choose the agent based on the type of your network. The Novell ZENworks Server Management traffic analysis tools include the Traffic Analysis Agent for NetWare and Traffic Analysis Agent for Windows, which you can use to monitor segments in your network. NetWare 5.x, the management server for Novell ZENworks Server Management, includes Novell eDirectory, which is leveraged by Novell ConsoleOne, to enable role-based administration.
The following sections provide information that will help you understand the Novell ZENworks Server Management traffic analysis functionality:
- About Network Monitoring Agents
- Role-Based Traffic Analysis Tasks
- Protocol Decodes Suite Supported by Novell ZENworks Server Management
About Network Monitoring Agents
Network monitoring agents provide the functionality to remotely monitor segments and devices on your network using SNMP. The agents collect and store statistical and trend information about nodes and devices on the network to provide real-time information about the status of your network. From your desktop, the agents let you troubleshoot and optimize Ethernet, FDDI, or token ring segments.
Based on the size and type of your network, you can use RMON, RMON Lite, RMON Plus, RMON2, or Bridge agents to monitor traffic. The following sections provide information to help you understand the functionality of agents:
- Functionality of RMON Agents
- Functionality of RMON Lite Agents
- Functionality of RMON Plus Agents
- Functionality of RMON2 Agents
- Functionality of Bridge Agents
- Viewing the Summarized RMON Information
Functionality of RMON Agents
RMON agents use a standard monitoring specification that allows various nodes and console systems on your network to exchange network data. This data can be used by a network administrator to monitor, analyze, and troubleshoot a group of distributed LANs from a central site. RMON is specified as part of the MIB in RFC 1757 as an extension of the SNMP.
RMON agents are ideally used for monitoring Ethernet, FDDI, or token ring segments.
RMON agents collect information in the following nine RMON groups of monitoring elements, each providing specific sets of data to meet network monitoring requirements. For details, see RFC 1757.
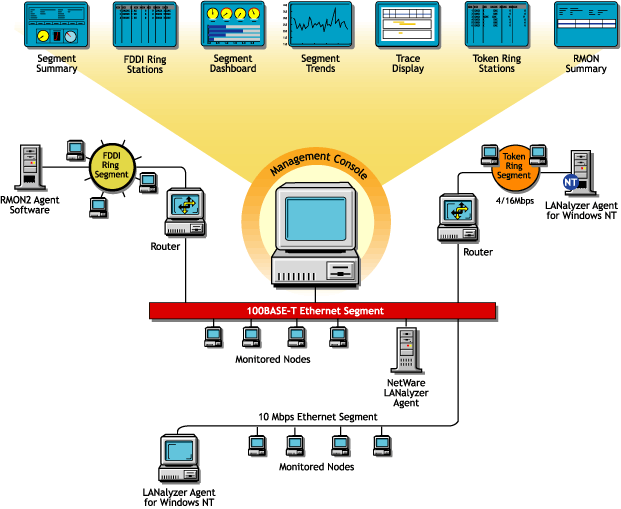
The following figure illustrates the Novell ZENworks Server Management views that you can display when you use an RMON agent to monitor the nodes and devices on your network.
Functionality of RMON Lite Agents
RMON Lite agents are ideally used for monitoring devices not dedicated for network management. For example, RMON Lite agents can be used to monitor a switch in your network.
RMON Lite agents support the following four RMON groups:
- Statistics
- History
- Alarm
- Event
Refer to the table in Functionality of RMON Agents for a brief description of each group.
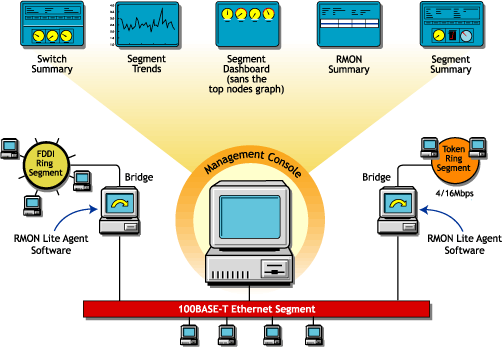
The following figure illustrates the Novell ZENworks Server Management views that you can display when you use an RMON Lite agent to monitor the nodes and devices on your network.
Functionality of RMON Plus Agents
RMON Plus agents are proprietary agents that extend the functionality of the RMON agent by providing data collected from the RMON groups, explained in Functionality of RMON Agents, and the groups explained in the following table.
RMON Plus agents are ideally used for monitoring Ethernet, FDDI, or token ring segments. Data from different media types can be collected based on the version of the RMON Plus agent that is used to monitor traffic on your network. Refer to the following table to determine the media type support based on the version of the RMON Plus agent.
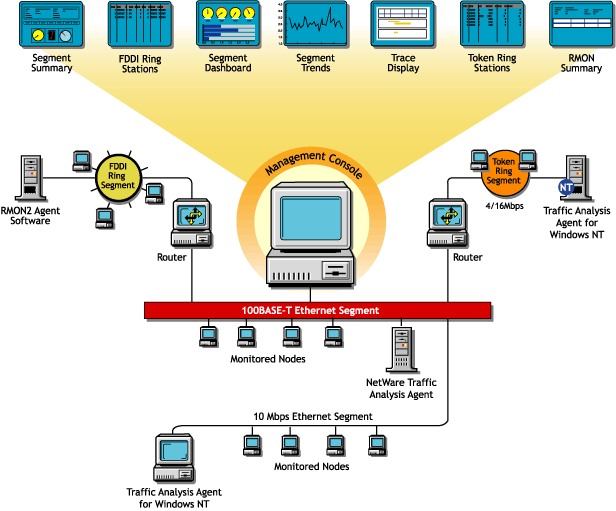
The following figure illustrates the Novell ZENworks Server Management views that you can display when you use an RMON Plus agent to monitor the nodes and devices on your network.
Functionality of RMON2 Agents
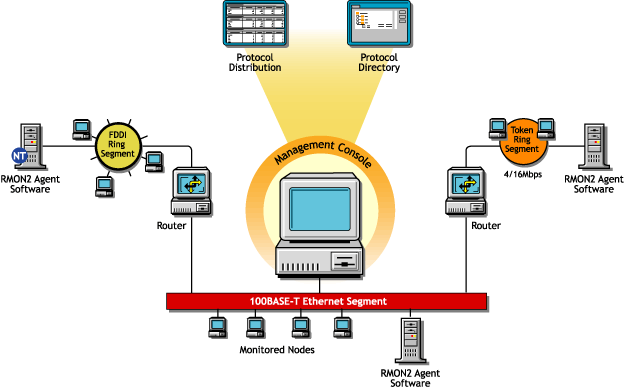
RMON agents can be used to collect data from nodes and devices in the physical and the data link layers and RMON2 agents can be used to collect data from nodes and devices in the network and application layers of your network. RMON2 agents can also determine network usage based on the protocol and application used by the nodes in your network. The following RMON2 groups make it possible to view traffic patterns above the data link layer. For details, see RFC 2021.
IMPORTANT: The Console supports only the Protocol Directory and Protocol Distribution groups.
The following figure illustrates the Novell ZENworks Server Management views that you can display when you use an RMON2 agent to monitor the nodes and devices on your network.
Functionality of Bridge Agents
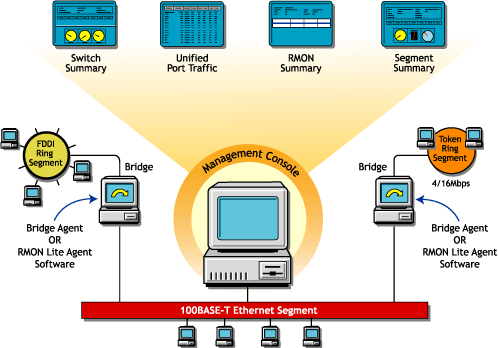
Bridges are used to connect LAN segments below the network layer. A bridge connects two or more physical networks, forwarding packets between networks based on the information in the data link header.
Bridge agents collect information in the following five Bridge groups. You can use this information to monitor switched networks. For details, see RFC 1493.
The following figure illustrates the Novell ZENworks Server Management views that you can display when you use a Bridge agent to monitor the nodes and devices on your network.
Viewing the Summarized RMON Information
The RMON Summary view provides brief information about RMON service on a selected node. It displays static information about the RMON agent and details of the resources requested by the user from the agent. The resource requests that are displayed in the RMON Summary view are Packet Capture and Host TopN requests.
To view the summarized RMON information:
The following table describes the static information displayed in the RMON Summary view.
The RMON Summary view displays the resource information described in the following table.
To delete a resource:
Role-Based Traffic Analysis Tasks
Novell ZENworks Server Management lets you perform the following traffic monitoring tasks based on your role:
- Add nodes to be monitored for inactivity.
For details, see Monitoring Nodes for Inactivity.
- Add protocols to the protocol directory tree.
For details, see Displaying a List of Protocols Used in Your Network.
- Capture packets.
For details, see Capturing Packets.
- Disable nodes from being monitored for inactivity.
For details, see Monitoring Nodes for Inactivity.
- Delete protocols from the protocol directory tree.
For details, see Displaying a List of Protocols Used in Your Network.
- Free agent resources.
For details, see Viewing the Summarized RMON Information.
- Set segment alarms.
For details, see Configuring Alarm Options from the Set Alarm Dialog Box.
- View conversations.
For details, see Viewing Conversations (Traffic) Between Nodes.
- View Traffic Analysis Agents.
For details, see Selecting the Preferred RMON Agent.
- View the protocol directory.
For details, see Determining the Distribution of Protocols in a Segment.
- View the RMON summary.
For details, see Viewing the Summarized RMON Information.
- View segment alarms.
For details, see Viewing Alarm Statistics for a Segment.
- View the segment dashboard.
For details, see Determining the Performance of Individual Segments.
- View segments monitored for inactivity.
For details, see Monitoring Nodes for Inactivity.
- View segment protocol distribution.
For details, see Determining the Distribution of Protocols in a Segment.
- View segment stations.
For details, see Listing Statistics for Segments.
- View the segment summary.
For details, see Viewing the Summarized Segment Information.
- View segment trends.
For details, see Analyzing Traffic on Segments.
- View switch or port traffic.
For details, see Viewing Statistics for Ports in a Switch.
- View the switch summary.
For details, see Viewing the Summarized Switch Information.
For more information about role-based services, see Role-Based Administration.
Protocol Decodes Suite Supported by Novell ZENworks Server Management
Novell ZENworks Server Management decodes several protocol suites. Using Novell ZENworks Server Management, you can analyze and troubleshoot problems in the following protocol suites:
- Novell NetWare Protocol Suite
- NetWork File System Protocol Suite
- Systems Network Architecture Protocol Suite
- AppleTalk* Protocol Suite
- TCP/IP Protocol Suite
You need to understand these protocols in order to set up packet capture and interpret the results in the Trace Display window. For more information about these protocol suites and decoding support, see Protocol Decodes Suites Supported by Novell ZENworks Server Management
Novell ZENworks Server Management also enables you to analyze and troubleshoot problems in the following media:
- Standard Ethernet
- IEEE 802.3
- Token Ring
- FDDI