8.4 Using the Endpoint Security Client Diagnostics Tools
The Endpoint Security Client features several diagnostics tools that can create a customized diagnostics package to be delivered to Novell Support to resolve any issues. Optionally, logging and reporting can be activated to provide full details regarding endpoint usage. Administrators can also view the current policy, add rule scripting, and check the Endpoint Security Client driver status.
The following sections contain more information:
8.4.1 Creating a Diagnostics Package
If problems occur because of the Endpoint Security Client’s presence on the endpoint, administrators can provide detailed diagnostics information packages to Novell Support. This information is vital in resolution of any issues. The diagnostics package is defined by the following items:
-
Group Policy Object: Captures the current GPO for the user/endpoint as designated by your directory service (for example, Active Directory).
-
Network Environments: Captures the current and detected network environments.
-
Registry Settings: Captures the current registry settings.
-
System Information: Captures all system information.
-
System Event Logs: Captures the current System Event logs.
-
Wireless Environment: Captures the current and detected wireless environments.
To create a diagnostics package:
-
Right-click the Endpoint Security Client icon, then click .

-
Click .

-
Select the items to be included in the package (all are selected by default).
-
Click to generate the package.
The generated package (ESSDiagnostics_YYYYMMDD_HHMMSS.zip.enc) is available on the desktop. This encrypted zip file can now be sent to Support.
8.4.2 Administrator Views
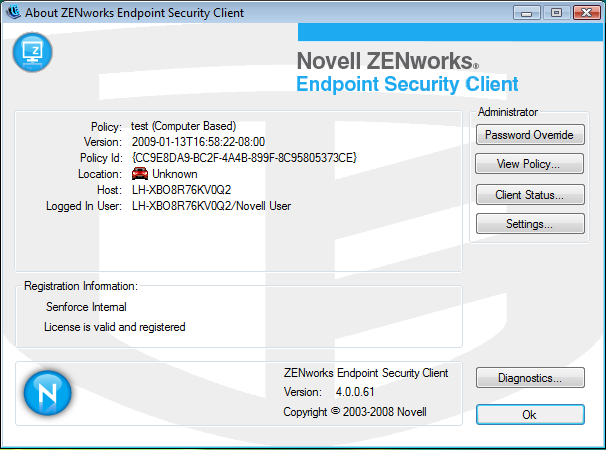
The Administrator views display only when password override is present in the policy. The Administrator views are added to the right side of the Endpoint Security Client About window under the Administrator heading.
Figure 8-1 Administrator Views
The following sections contain more information:
Password Override
Use the button to temporarily override policy settings by loading an Allow-All policy. Type the password and click .
Figure 8-2 Entering the Override Password
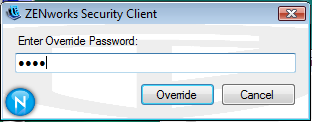
After the password is entered, the button changes into . When you enter the password, you do not need to enter it again until you click the button, which reverts back to the running user policy.
Password overrides can also be set up for a specified amount of time. When that time expires, the running user policy is again loaded and the button appears.
View Policy
The button displays the current policy on the device. The display shows basic policy information and can be used to troubleshoot suspected policy issues.
Figure 8-3 View Policy Window
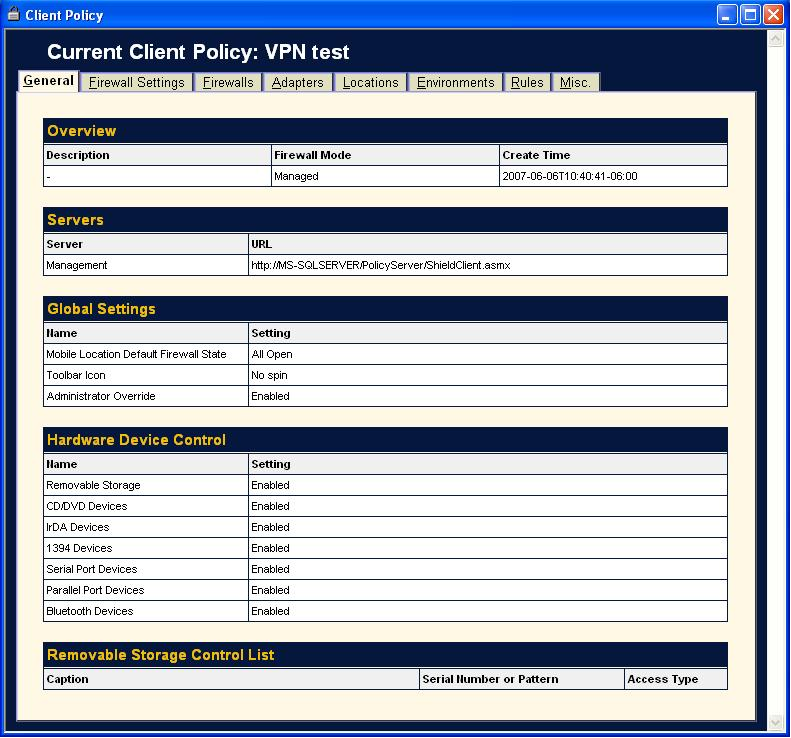
The policy display divides the policy components into the following tabs:
-
General: Displays the global and default settings for the policy.
-
Firewall Settings: Displays the Port, ACL, and Application groups available in this policy.
-
Firewalls: Displays the firewalls and their individual settings.
-
Adapters: Displays the permitted network adapters.
-
Locations: Displays each location, and the settings for each.
-
Environments: Displays the settings for defined network environments.
-
Rules: Displays integrity and scripting rules in this policy.
-
Misc: Displays assigned reporting, hyperlinks, and custom user messages for this policy.
Client Status
The button displays the current status of the client and affected components.
Figure 8-4 ZESM Client Status Window
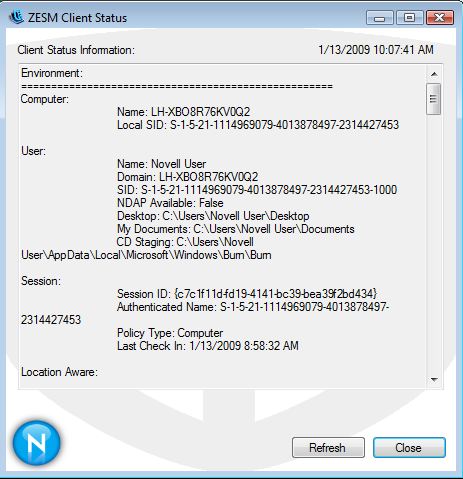
The client status includes information on the following objects:
-
Environment: Information on the computer, user, and the present session.
-
Location Aware: Information on the policy distinguishing the computer’s location and its adapter environment.
-
OS Adapter List: Lists the communication elements for the computer hosting the client.
-
Network Status: Whether the client is connected to a network and whether it is a wired, wireless, or a modem connection.
-
Firewall Enforcement: The firewall the client is using and its present state.
-
Volume Management: The devices and volumes that are presently found on the client.
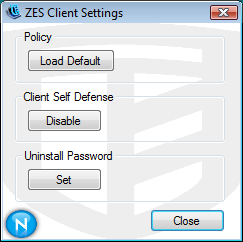
Settings
The button lets administrators adjust the settings for the Endpoint Security Client without reinstalling the software.
Figure 8-5 Endpoint Security Client Settings Control
The following sections contain more information:
Reset to Default Policy
Restores the original installed policy, whether that policy is a resource file or one that is distributed as part of the install package. Use this option if you need to access a policy with few or no restrictions enabled. This policy is permanent. To enforce a different policy, you must publish that policy to the client.
Disable Client Self Defense
Disables all protections used to keep the client installed and active on the machine.
Set Uninstall Password
Resets the password required to uninstall the Endpoint Security Client. If no uninstall password is presently set, the administrator is prompted with a window to enter the uninstall password. When the password is set, the button becomes and a button is added. Use to change the uninstall password, and use to clear the uninstall password.
8.4.3 Module List
The option shows all of the ZENworks Endpoint Security modules that are presently loaded on the client machine. To get to the Module List, double-click the Endpoint Security Client icon in the notification area to bring up ZENworks Endpoint Security Client About window, then click .
Figure 8-6 Module List
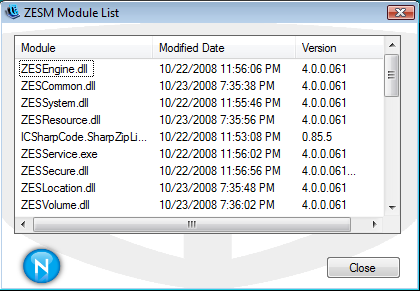
The Module List window displays all of the modules that are presently loaded on the client machine, the date the module was last modified, and the module’s version number. Use this information to check this client’s version for diagnostic purposes.
Click the , , and headings to toggle names, dates, and versions. Click to close the Module List window.
8.4.4 Logging
Logging can be turned on for the Endpoint Security Client, permitting it to log specific system events. Log files are saved in the C:\users\allusers\novell\ZES\log directory (this is a hidden folder, so you will need to change the folder options to see the folder). To turn on and configure logging, double-click the Endpoint Security Client icon in the notification area to bring up ZENworks Endpoint Security Client About window, then click .
Figure 8-7 Logging Window
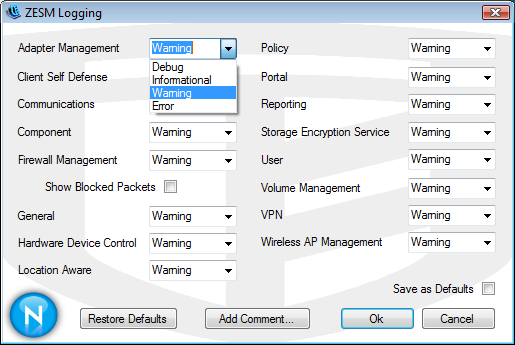
By default, all logging events are set to , but you can set each listed event to the following:
-
Debug: Turns on every possible message and includes Informational, Warning and Error messages.
-
Informational: Records all events when they occur, such as when a network connection event begins and ends.
-
Warning: Records errors that have occurred but are solvable and do not prevent the client from running.
-
Error: Records errors that have occurred and prevent the client from running.
Use the button to save a particular configuration. The configuration is then saved to the C:\users\allusers\novell\ZES\log directory, where it can be used the next time you select . Select to restore the Logging window to its default state (all events to if is not selected), or to the state when you selected .
When troubleshooting, it is recommended that you set logging according to the directions of Novell Support and recreate the circumstances that led to the error to see if it can be repeated.
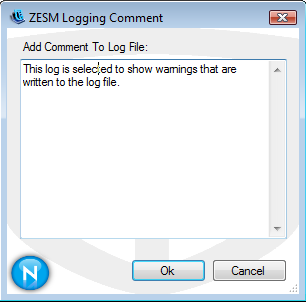
Add Comment
The option to add a comment to the logs is available in the Logging window. Click the button to display the Logging Comment window. Comments are included with the next batch of logs.
Figure 8-8 Comment Window