After the initial discovery, you can stop discovery running on the management server. You can, however, continue to access the database through the Atlas Manager. The discovery cycle starts again the next time NetExplorer is up. The Consolidator populates the database and the Atlas Manager automatically updates the atlas pages.
Depending on the size of your network, writing data from the initial discovery cycle can take few minutes to several days. Subsequent discovery updates to the database require substantially less time.
When ZfS is first installed, the server module of the Atlas Manager is automatically installed on the management server, and the client module of the Atlas Manager is installed on ConsoleOne. The Atlas Manager on the management server creates a system atlas and provides a graphical view of the database at the console.
The Atlas Manager on the server reads the database and provides two different views of the database at ConsoleOne: the Console view and Atlas view. Both views provide information about the discovered network topology, the physical location of nodes, node configuration information, and alarm information.
The following sections gives you an understanding about using the atlas:
You can access the ZfS atlas from ConsoleOne. Open ConsoleOne and double-click the ZfS Domains namespace, then expand the domain. The system atlas appears.
The following table describes a ZfS atlas consisting of three different pages:
Atlas Pages
Icon
Description
WAN page
Summarizes the entire network, illustrating the WAN-related network topology. Your atlas, typically, has a single WAN page.
Area page
Displays segments on your network. An atlas can have several area pages. For example, areas can be divided based on the geographic location of the network. If a company in San Jose has an overseas branch in Germany, you can divide your network into Area1 for the San Jose network and Area2 for the Germany network.
Islands page
Consists of segments with an undetermined connectivity. During discovery, the Islands page is a placeholder for network objects that are not completely discovered. An atlas has a single Islands page.
Customizing Your Atlas View
You can customize your atlas view in four different ways:
Insert a custom bitmap as the background on an atlas page.
Change the position of a node on an atlas page by dragging it.
Display objects by an alternate name.
Assigning Roles to Help You Manage the Atlas
ZfS lets you assign roles to manage the atlas. By assigning roles, you can restrict the user from performing specific operations on that object.
HINT: The atlas displays maps based on your role on the network. For example, if your role is restricted to managing certain servers in segment A and B, your atlas will contain only those servers in segments A and B.
You can perform the following tasks on any atlas page (WAN, Islands, or Area page) when the Atlas view is displayed on ConsoleOne.
Tasks
Comments
Open
Opens the page
Import
Inserts a custom wallpaper
Save
Updates the changes in the database
Print
Prints the page
Rename
Renames the page
Layout
Displays the page with a different focal point
Using the Atlas to Troubleshoot
By setting the alarm disposition to save alarms in the database, ZfS maps can alert you to alarm conditions on the network. Alarms are of type severe, major, or minor alarm on a segment or node. Upon recognizing any of these alarms, the ZfS ConsoleOne displays a bell-shaped alarm icon above the object. The alarm status is propagated up the hierarchy. For example, if a server has an alarm of type severe, the segment and the page containing the server will display the corresponding alarm icon. For information about alarms, Managing the Alarm Management System .
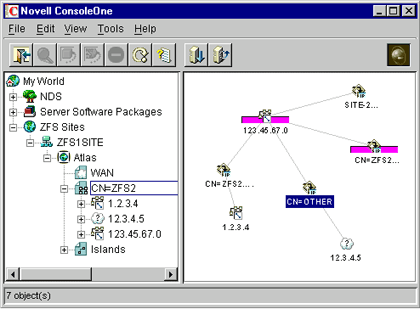
The following figure shows the atlas namespace in ConsoleOne:
Using Unified Views
The Unified view service is a service that acts as a filter on the atlas. Using the Unified view, you can filter for a list of devices or segments of a particular type. The Unified view allows easy navigation and quick operations to check the highest severity of the alarms present on a particular node or segment.
The following are the two types of Unified view provided:
You can view All, Manageable, or Unmanageable devices in this view. For a corresponding device type, a device is said to be manageable if the list of MIBs implemented by the device satisfies the Manageability_definition property in the UnifiedView.ini file in the ZENWORKS\MMS\MWSERVER\BIN directory. The Manageability_definition property can be updated with a valid boolean expression of MIB names.
Following are the device types that you can filter:
All (all types of devices)
Netware Servers
NCP Print Servers
TCP Services
Printers
IP Routers
Switches/Bridges
IPX Routers
Windows NT Servers
To filter the devices:
In the atlas, select View > Unified View for Devices.
From the first drop-down list, select All to list all the devices
or
Select Manageable to list the manageable devices
or
Select Unmanageable to list the unmanageable devices.
From the second drop-down list, select a device type.
Click Show.
The Unified view will display the list of the devices. The tabular column in the Unified view contains the following information.
The icons associated with the devices.
The MIBs implemented by the device. If the device does not implement any MIBs the column will specify "No MIBs implemented" for that device.
The maximum severity of the alarms against the devices. To view the legend for the alarm, select the alarm legend button on the toolbar.
Unified View for Segments
You can view All, Manageable, or Unmanageable segments in this view. For a corresponding segment type, a segment is said to be manageable if the list of MIBs implemented by at least one device in that segment satisfies the Manageability_definition property in the UnifiedView.ini file. The Manageability_definition property can be updated with a valid boolean expression of MIB names. The following are the segment types you can set filter for:
All (all types of segments)
Ethernet
Frame Relay
IPX Compatibility Mode
Token Ring
X.25
PPP
ATM
FDDI
To filter the segments:
At the Atlas level, select View > Unified View for Segments.
From the first drop-down list, select All to list all the segments
or
Select Manageable to list the manageable segments
or
Select Unmanageable to list the unmanageable segments.
From the second drop-down list, select a segment type.
Click Show.
The Unified view will display the list of the segments. The tabular column in the Unified view contains the following information.
The icons associated with the segments.
The name of the segment.
The maximum severity of the alarms against the segments. To view the legend for the alarm, select the alarm legend button on the toolbar.