6.5 Directory Data Reports
Reports in this classification include Summary, Directory Quota, Storage Cost, and Comparison Reports.
Before generating any type of Directory Data report, you must first conduct a File System scan on the volumes or shares you want to report on.
6.5.1 Generating a Summary Report
Summary reports provide a summary of the contents of folders according to a specified level in the file system.
-
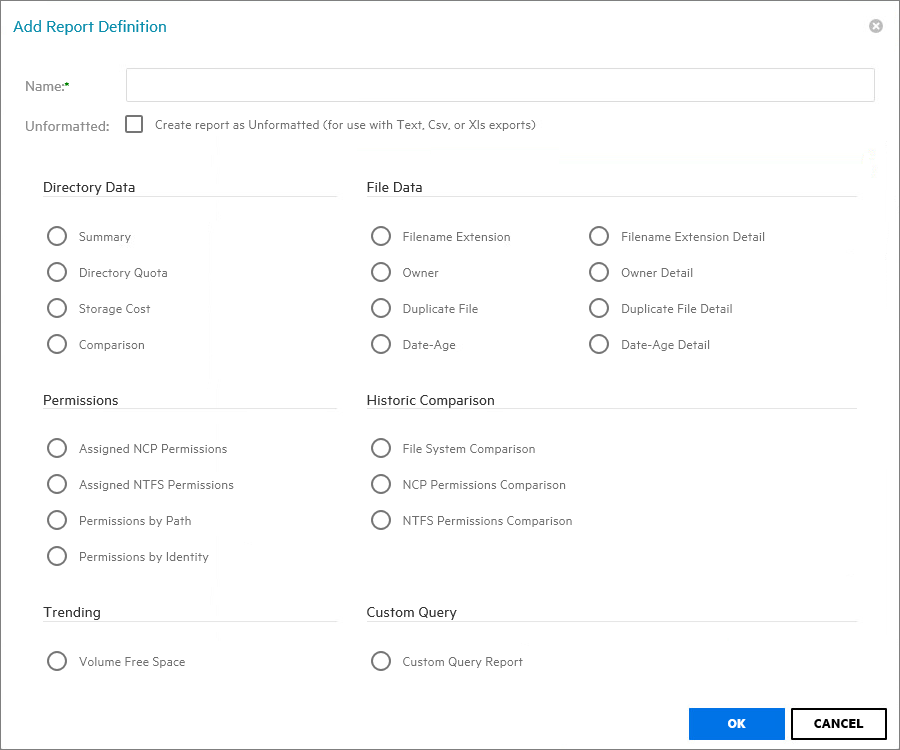
Select > .
-
Click .
-
In the field, specify a descriptive name of the report definition.
For example, User Volume Summary Report.
The name can contain up to 64 alphanumeric characters.
-
Select the option and click .
-
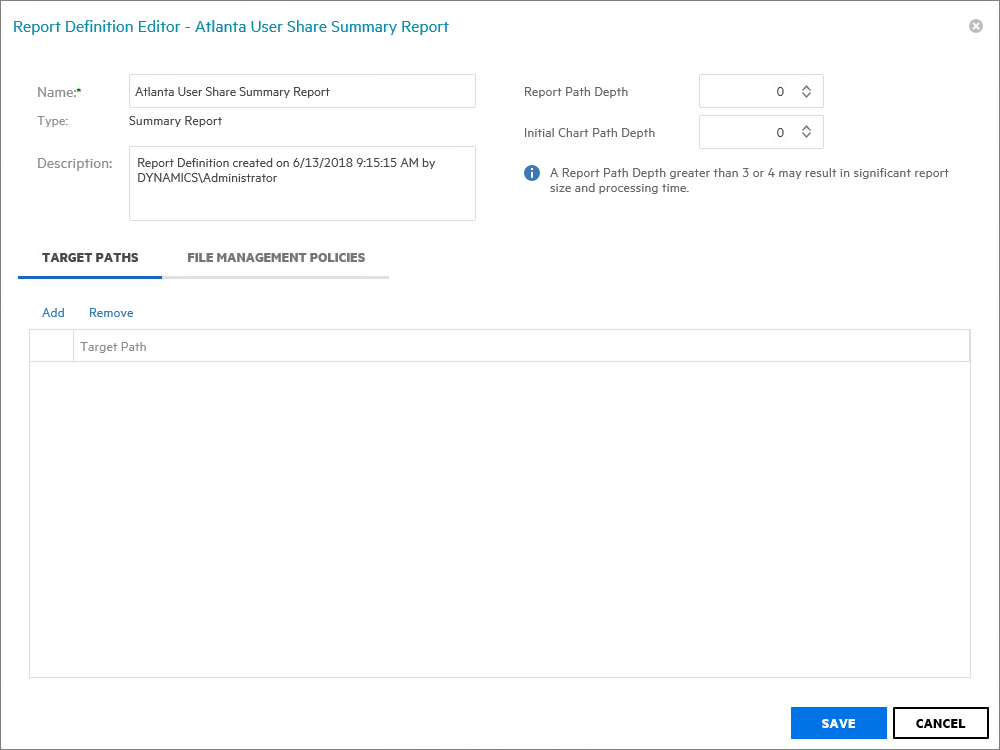
In the field, specify the depth of reporting.
For example, if you select 3, the Summary report lists the file contents of all file paths in the specified shares up to 3 levels in the file structure.
For example, for a server named Las Vegas, the Summary report would list the contents of these paths:
\\lasvegas.nvb.local\Users1
\\lasvegas.nvb.local\Users1\a
\\lasvegas.nvb.local\Users1\a\stuff
\\lasvegas.nvb.local\Users1\a\stuff\morestuff
-
In the field, specify the initial path depth for inclusion in the Top Ten Folders by Size chart that is displayed in the report header section.
This is important so that when the is greater than zero, the top level folders are now conditionally included. The parameter is not allowed to be greater than the currently specified .
-
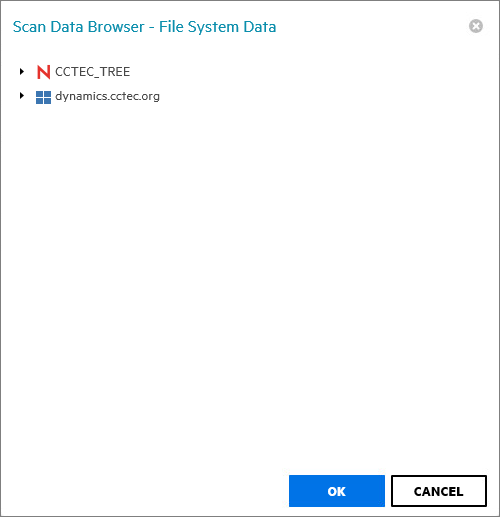
From the tab, click .
-
Click the > to browse to and select the file paths you want included in the report, then click .
You must expand the eDirectory tree or Active Directory forest to be able to select the volumes or shares, even if you want to select the root of the eDirectory tree or Active Directory forest.
-
Click .
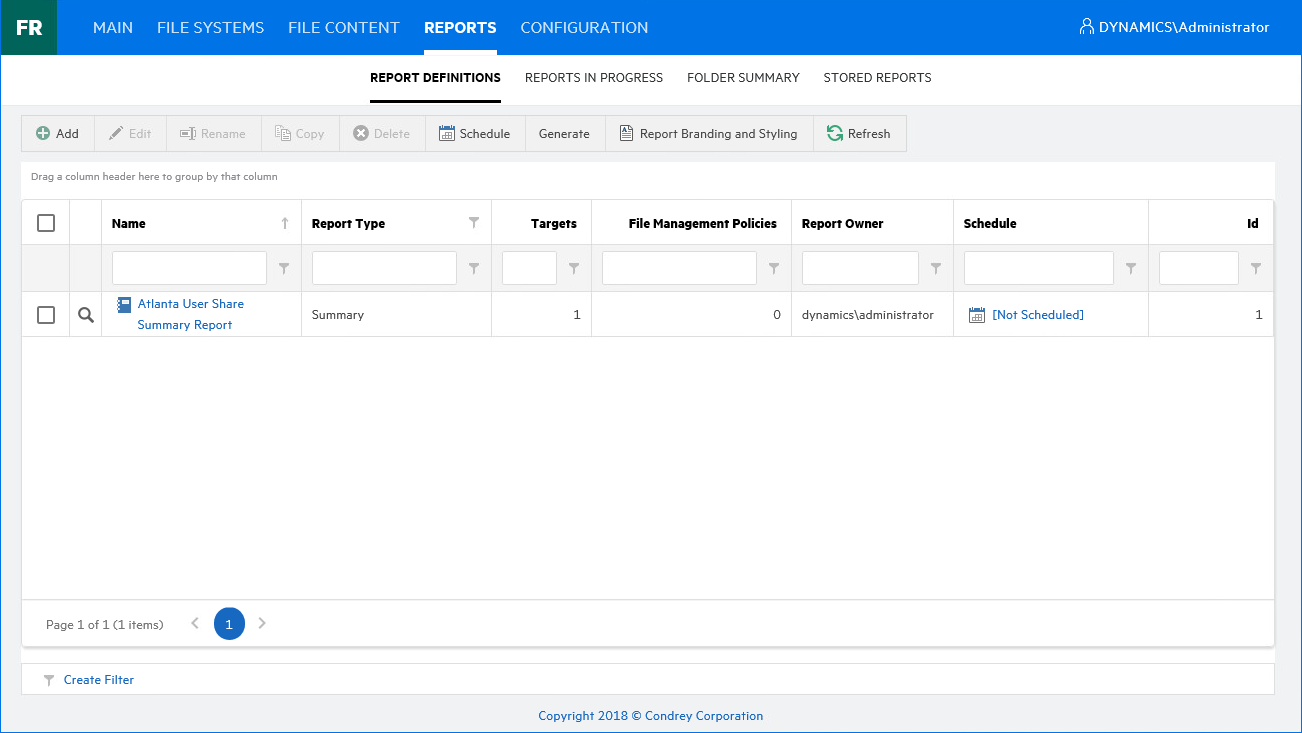
The report definition is added to the list.
-
Do one of the following:
-
Generate the report in Preview mode by following the procedures under Generating a Preview Report.
-
Generate the report in Stored mode by following the procedures under Generating a Stored Report.
-
Generating a Preview Report
A preview report is generated from scan data in the database and is temporarily cached in the Web application's data folder. When you close a preview report, you cannot access the report again until you generate a new one using the same report definition.
When you view a report in Preview mode, you can print the report or save the report locally.
-
From the Report Definitions page, select the report definition from which you want to generate a report.
-
Select > .
-
(Conditional) If you get a message stating that your browser prevented pop-up windows from appearing, enable pop-ups for this site.
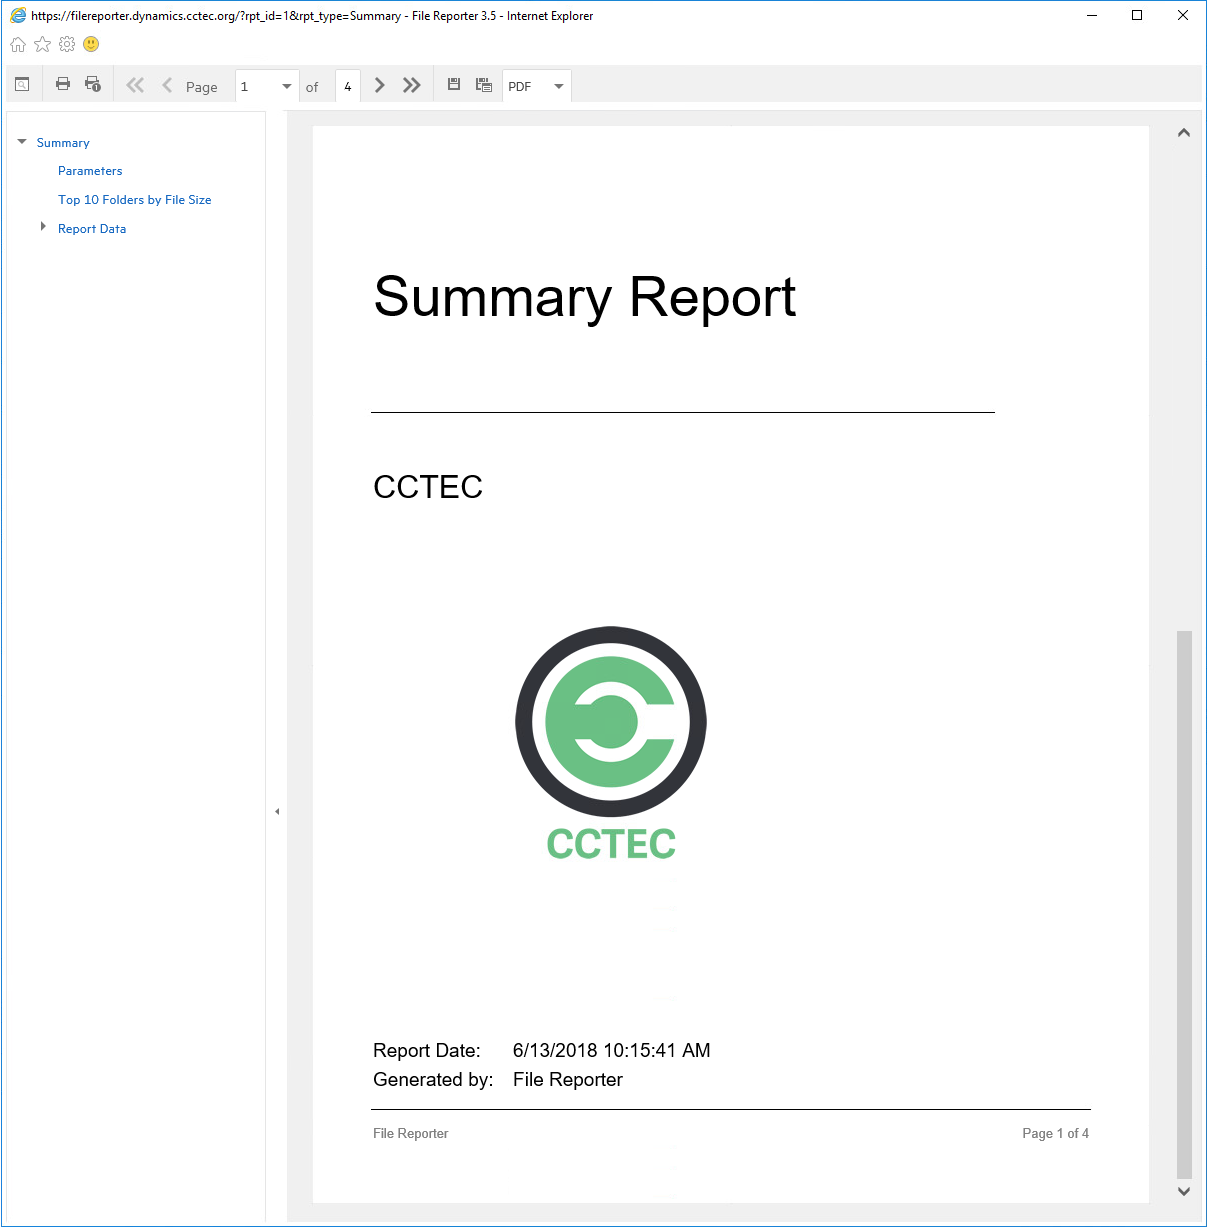
All reports are structured similarly, with a title page, report parameters, for some report types a Top Ten summary, followed by a comprehensive breakdown of the data in the pages that follow.
Display the Search Window button: Lets you conduct a search within the preview report.
Print the Report button: Prints the entire preview report.
Print the Current Page button: Prints the currently displayed page.
First Page button: Takes you to the first page of the preview report.
Previous Page button: Takes you to the page that precedes the page you are viewing.
Page drop-down menu: Lets you advance to a page number by selecting it.
Next Page button: Takes you to the page that follows the page you are viewing.
Last Page button: Takes you to the last page of the preview report.
Export a Report and Save it to the Disk button: Exports the preview report to the file type listed in the drop-down menu and lets you view or save it in the new format.
Export a Report and Show it in a New Window button: Exports the preview report to the file type listed in the drop-down menu.
File Type drop-down menu: Lets you select the file type format to export the report to.
Document Navigation: Lists the contents of the report. You can click any item to advance within the preview report.
-
Export, save, or print the preview report.
Generating a Stored Report
Generating a report in Stored mode means that the report is saved and available for access for a set number of days from the time it is generated. Of course, you can save the report locally where you can keep it indefinitely.
-
From the Report Definitions page, select >
-
Select > .

-
Click the report you want to view.
-
(Conditional) If you get a message stating that your browser prevented pop-up windows from appearing, enable pop-ups for this site.
All reports are structured similarly, with a title page, report parameters, for some report types a Top Ten summary, followed by a comprehensive breakdown of the data in the pages that follow.
Display the Search Window button: Lets you conduct a search within the preview report.
Print the Report button: Prints the entire preview report.
Print the Current Page button: Prints the currently displayed page.
First Page button: Takes you to the first page of the preview report.
Previous Page button: Takes you to the page that precedes the page you are viewing.
Page drop-down menu: Lets you advance to a page number by selecting it.
Next Page button: Takes you to the page that follows the page you are viewing.
Last Page button: Takes you to the last page of the preview report.
Export a Report and Save it to the Disk button: Exports the preview report to the file type listed in the drop-down menu and lets you view or save it in the new format.
Export a Report and Show it in a New Window button: Exports the preview report to the file type listed in the drop-down menu.
File Type drop-down menu: Lets you select the file type format to export the report to.
Document Navigation: Lists the contents of the report. You can click any item to advance within the report.
-
Save or print the stored report.
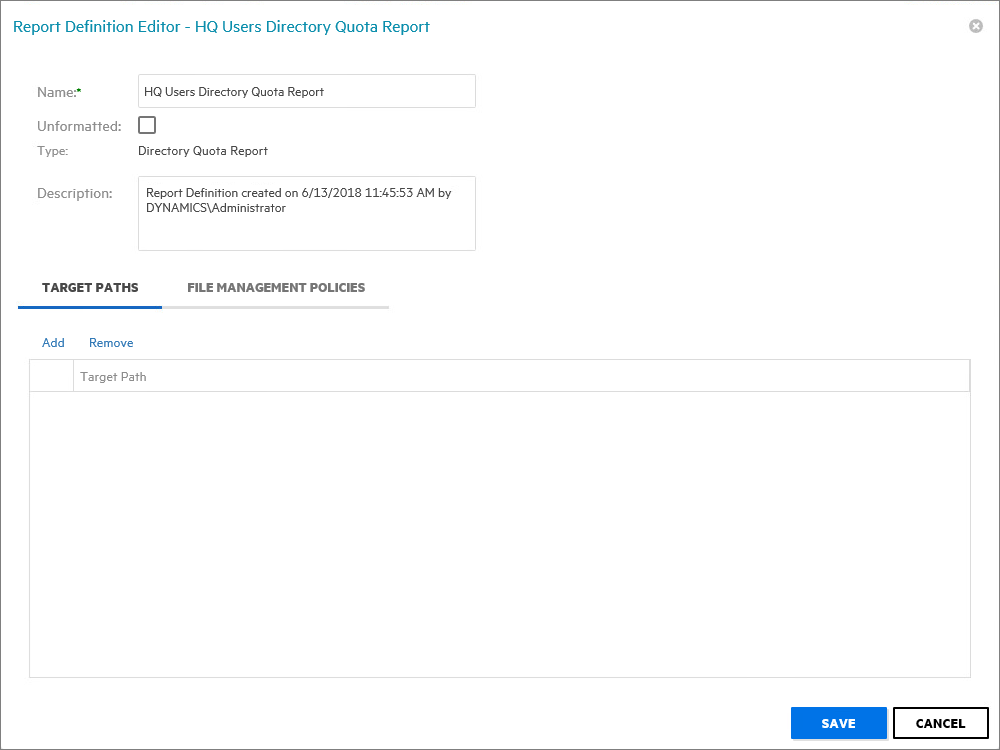
6.5.2 Generating a Directory Quota Report
Directory Quota reports specify folders with assigned quota, the amount of quota assigned, and the amount of quota consumed.
-
Select > .
-
Click .
-
In the field, specify a descriptive name of the report definition.
-
Select the option and click .
-
From the tab, click .
-
Browse to and select the file paths you want included in the report and click .
-
Click .
-
Generate the report as either a Preview report or a Stored report.
For procedures on generating a Preview report, see Generating a Preview Report.
For procedures on generating a Stored report, see Generating a Stored Report.
6.5.3 Generating a Storage Cost Report
Storage Cost reports indicate storage costs according to prices established in the setting of the Report Definition editor. You can use this report to determine which users or groups are being irresponsible with network storage practices.
NOTE:When the report is generated, the monetary symbol that is displayed comes from the local Engine/Web server's Windows locale and region settings. For example, if the Windows server hosting the engine and Web application is set up using US locale and region, it will show a $ for costing displays in the report.
-
Select > .
-
Click .
-
In the field, specify a descriptive name of the report definition.
-
Select the option and click .

-
In the drop-down menu, select the storage unit value for which you want to establish a cost.
-
In the field, indicate the cost of the selected storage unit.
-
From the tab, click .
-
Browse to and select the file paths you want included in the report and click .
-
Click .
-
Generate the report as either a Preview report or as a Stored report.
For procedures on generating a Preview report, see Generating a Preview Report.
For procedures on generating a Stored report, see Generating a Stored Report.
6.5.4 Generating a Comparison Report
A Comparison report specifies the differences between two selected folders on the network. This is useful if you want to verify that servers are hosting the same version of software, library files on servers are the same, and so forth.
-
Select > .
-
Click .
-
In the field, specify a descriptive name of the report definition.
-
Select the option and click .

-
In the drop-down menu, select an option.
Show unique paths from both targets: The report indicates the differences in folder and file names for the compared target paths.
Show paths unique to the first target: The report indicates only the unique folder and file names found in the first target path.
Show paths unique to the second target: The report indicates only the unique folder and file names found in the second target path.
-
From the tab, click
-
Browse to and select two volumes, shares, or folders whose data you want to compare and click .
-
Click .
-
Generate the report as either a Preview report or as a Stored report.
For procedures on generating a Preview report, see Generating a Preview Report.
For procedures on generating a Stored report, see Generating a Stored Report.