4.2 Monitoring Proxy Statistics
This section has the following information:
4.2.1 Monitoring Proxy Cache Real-time Activity
To view proxy cache activity information:
-
Log in to the Novell Remote Manager.
-
Select .
-
Click . The page is displayed.
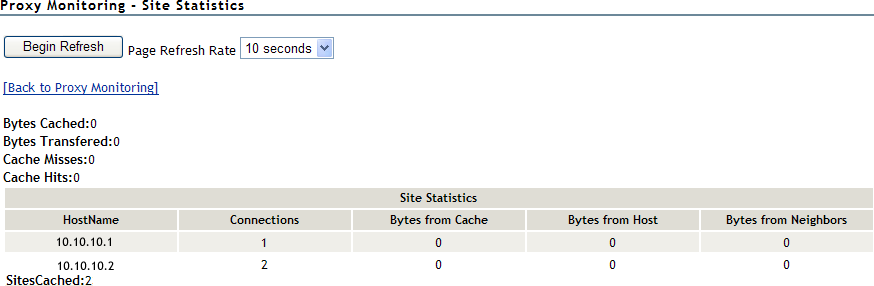
The following site statistics are displayed on this page:
Bytes Cached: Number of bytes cached on the proxy server.
Bytes Transferred: Number of bytes transferred to the proxy server.
Cache Misses: Number of times the cache was unable to serve a client request.
Cache Hits: Number of times the cache was able to serve a client request.
Hostname: Name of the Web server, including the name of the service (HTTP, for example) and the DNS domain name of the server.
Connections: Number of TCP connections required for a direct connection to the host server. This number represents the number of connections the proxy cache has saved its clients, because Proxy Services has cached the site.
Bytes from Cache: Number of bytes transferred from the cache.
Bytes from Host: Number of bytes transferred from the host to the cache.
Bytes from Neighbors: Number of bytes transferred from the nearest neighbors to the cache.
Sites Cached: Total number of proxy sites currently in the cache.
-
To update the statistics at a regular interval, select a value from the drop-down list and click .
-
To stop regular updating of statistics, click .
-
To go back to the proxy monitoring page, click .
4.2.2 Monitoring HTTP Statistics
To view the HTTP proxy activity information:
-
Log in to the Novell Remote Manager.
-
Select .
-
Click . The page is displayed.
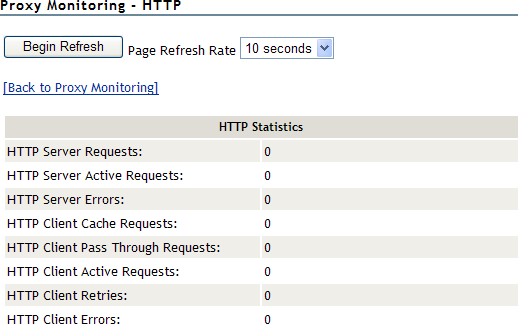
The HTTP statistics are displayed on this page.
-
To update the statistics at a regular interval, select a value from the drop-down list and click .
-
To stop regular updating of statistics, click .
-
To go back to the proxy monitoring page, click .
4.2.3 Monitoring FTP Statistics
To view the FTP proxy activity information:
-
Log in to the Novell Remote Manager.
-
Select .
-
Click . The page is displayed.
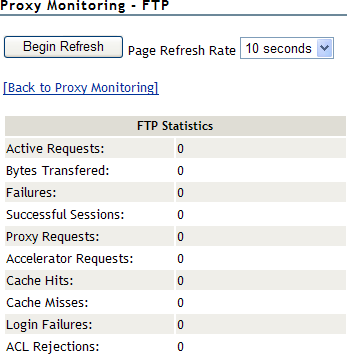
The FTP statistics are displayed on this page.
-
To update the statistics at a regular interval, select a value from the drop-down list and click .
-
To stop regular updating of statistics, click .
-
To go back to the proxy monitoring page, click .
4.2.4 Monitoring Mail (SMTP/POP3) Statistics
To display the Proxy Cache Monitor window and view proxy cache activity information:
-
Log in to the Novell Remote Manager.
-
Select .
-
Click . The page is displayed.
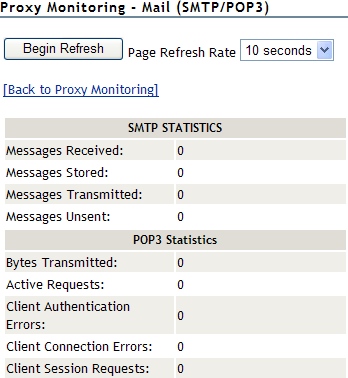
The SMTP and POP 3 statistics are displayed on this page.
-
To update the statistics at a regular interval, select a value from the drop-down list and click .
-
To stop regular updating of statistics, click .
-
To go back to the proxy monitoring page, click .
4.2.5 Monitoring Gopher Statistics
To view gopher statistics:
-
Log in to the Novell Remote Manager.
-
Select .
-
Click . The page is displayed.
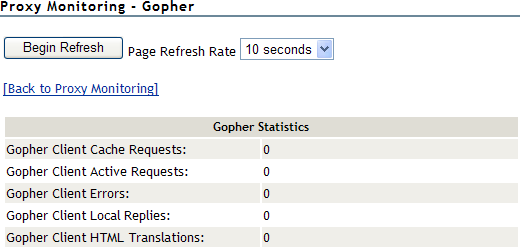
The Gopher statistics is displayed on this page.
-
To update the statistics at a regular interval, select a value from the drop-down list and click .
-
To stop regular updating of statistics, click .
-
To go back to the proxy monitoring page, click .
4.2.6 Monitoring RealAudio Statistics
To display the Proxy Cache Monitor window and view proxy cache activity information:
-
Log in to the Novell Remote Manager.
-
Select .
-
Click . The page is displayed.
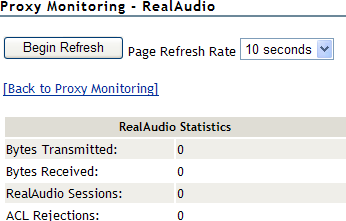
The Real Audio statistics is displayed on this page.
-
To update the statistics at a regular interval, select a value from the drop-down list and click .
-
To stop regular updating of statistics, click .
-
To go back to the proxy monitoring page, click .
4.2.7 Monitoring SOCKS Statistics
To view proxy cache activity information:
-
Log in to the Novell Remote Manager.
-
Select .
-
Click . The page is displayed.
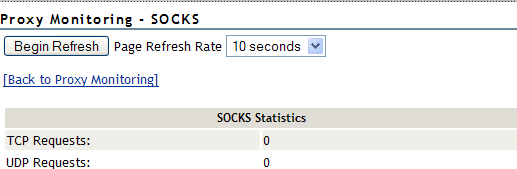
The SOCKS statistics is displayed on this page.
-
To update the statistics at a regular interval, select a value from the drop-down list and click .
-
To stop regular updating of statistics, click .
-
To go back to the proxy monitoring page, click .
4.2.8 Monitoring Generic Statistics
To view Generic proxy activity information:
-
Log in to the Novell Remote Manager.
-
Select .
-
Click . The page is displayed.
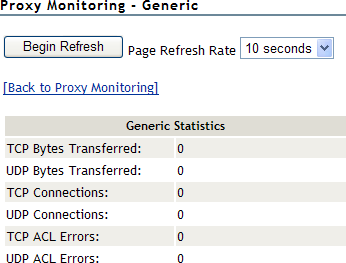
This page displays the generic statistics on in this page:
-
To update the statistics at a regular interval, select a value from the drop-down list and click .
-
To stop regular updating of statistics, click .
-
To go back to the proxy monitoring page, click .
4.2.9 Monitoring ICP Statistics
To view ICP statistics:
-
Log in to the Novell Remote Manager.
-
Select .
-
Click . The page is displayed.
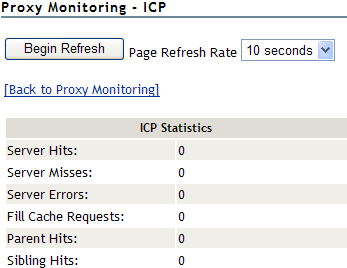
The ICP statistics are displayed on this page.
-
To update the statistics at a regular interval, select a value from the drop-down list and click .
-
To stop regular updating of statistics, click .
-
To go back to the proxy monitoring page, click .
4.2.10 Monitoring Client FTP Statistics
To view the client FTP statistics:
-
Log in to the Novell Remote Manager.
-
Select .
-
Click . The page is displayed.
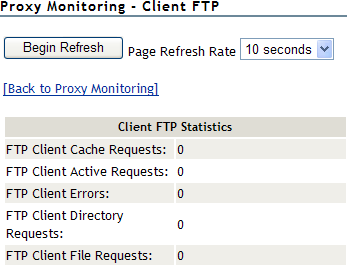
The Client FTP statistics is displayed on this page.
-
To update the statistics at a regular interval, select a value from the drop-down list and click .
-
To stop regular updating of statistics, click .
-
To go back to the proxy monitoring page, click .