
  |
You can check that the connection between routers is active by performing the following tasks:
This topic contains the following sections:
To determine whether a link is active, load MONITOR and follow this path:
Select LAN/WAN Information > interface you want to view
Under Generic Statistics, look at the Total Packets Sent and Total Packets Received counters. The link is active if these counters are increasing.
To determine whether a remote router is reachable, you can run an Echo test. To run an Echo test, load PPPCON and follow this path:
Select PPP Interfaces > interface you want to view > PPP Echo Test
The following information is displayed:
You can determine the location of a failure point by capturing PPP packet exchanges. To do this, load PPPTRACE and complete the following steps:
From the Available Options window, select Configuration.
Select Capture Device.
Select whether you want to capture the data to RAM or to Disk. If you select Disk, specify the filename in the Disk Filename field.
Press Esc to go back to the Available Options window.
Select Real-Time Monitor to view and capture the PPP protocol exchanges.
The Real-Time Monitor window is displayed.
Press F7 to begin capturing the information.
Press F7 when you want to end the capture.
You can also use the following keys:
F2 ---Displays the statistics for the next interface.
F3 ---Toggles the display between raw mode (no decode of any PPP frames) and decode mode (PPP frames fully decoded).
F5 ---Toggles the display between Hex and ASCII.
F6 ---Enables you to freeze and resume the continuous display of data.
F8 ---Selects the next interface.
F9 ---Selects the preceding interface.
Establish the call.
If you are testing outgoing calls, use CALLMGR on the local router to initiate the call. If you are testing incoming calls, use CALLMGR on the remote router to initiate the call.
Press F7 to stop the capture when the desired data has been sent.
Press Esc to return to the PPPTRACE menu.
Select Playback to view the captured data at your convenience.
The captured data might show one of the following problems:
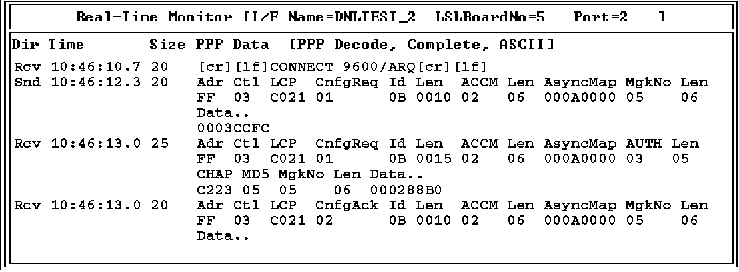
Figure 9 shows a sample PPP packet exchange.
Figure 9
Real-Time Monitor Capturing PPP Packet Exchanges
Monitoring your communications equipment can help you identify the source of some common problems with your local modem or data circuit-terminating equipment (DCE) device, including the following:
If the modem or DCE device cannot answer an incoming call or cannot initiate an outgoing call, you might need to reset it. Before resetting the device, check the following information:
If the modem or DCE device can initiate an outgoing call but cannot connect, you might need to change the settings or the hardware. To determine your course of action, check the following information:
Select Configure NIAS > Protocols and Routing > Network Interfaces > Physical Options
To capture and decode modem or DCE device dialogs, load PPPTRACE and complete the following steps:
From the Available Options window, select Configuration.
Select Capture Device.
Select whether you want to capture the data to RAM or to Disk. If you select Disk, specify the filename in the Disk Filename field.
Press Esc to go back to the Available Options window.
Select Real-Time Monitor to view and capture the modem or DCE device dialog.
The Real-Time Monitor window appears.
Press F7 to begin capturing the modem or DCE device dialog.
Press F7 when you want to end the capture.
You can also use the following keys:
F2 ---Displays the statistics for the next interface.
F5 ---Toggles the display between Hex and ASCII.
F6 ---Enables you to freeze and resume the continuous display of data.
F8 ---Goes to the next interface.
F9 ---Returns to the preceding interface.
Establish the call.
If you are testing outgoing calls, use CALLMGR on the local router to initiate the call. If you are testing incoming calls, use CALLMGR on the remote router to initiate the call.
Press F7 to stop the capture when the desired data has been sent.
Press Esc to return to the PPPTRACE menu.
Select Playback to view the captured data at your convenience.
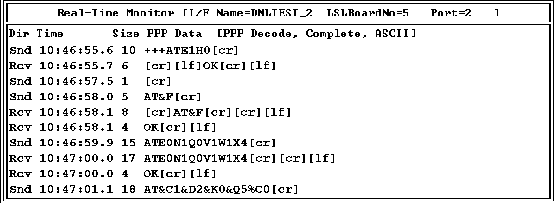
You can expect to see the response OK or an echoed command for each initialization string sent to the modem. If the modem does not respond, check the power and cable connections.
Figure 10 shows a sample modem dialog.
Figure 10
Real-Time Monitor Capturing a Modem Dialog
To monitor the serial interface signals raised by the modem or the DCE device, load MONITOR and follow this path:
Select LAN/WAN Information > interface you want to view
Under the specific board's statistics section, look for serial interface signals such as DTR, DSR, RTS, CTS, and DCD (1=on, 0=off).
To reset the modem or DCE device, load PPPCON and follow this path:
Select PPP Interfaces > interface you want to view > PPP Reset Modem > Reset Modem
The following information is displayed on the PPP Reset Modem window:
Error counters are monitored to make sure they are not increasing rapidly, because a rapid increase indicates a problem. You can monitor error counters for PPP interfaces in the following ways:
Select LAN/WAN Information > interface you want to view
To view these counters, load PPPCON and follow this path: Select PPP Interfaces > interface you want to view > PPP Error Statistics
To view these counters, load IPXCON and follow this path: Select IPX Information > Detailed IPX Information
To view these counters, load TCPCON and follow this path: Select Statistics > IP > More IP Statistics
To view these counters, load ATCON and select Packet Statistics.
  |